Population
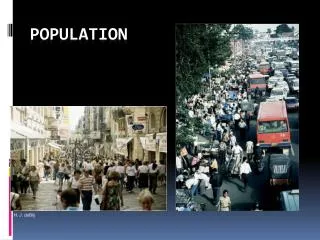
Population. http://www.poodwaddle.com/clocks/worldclock. APHG – Spring 2013. If we shrank the Earth's population to a village of 100 people, with all of the existing human ratios remaining the same, there would be:.

Population
E N D
Presentation Transcript
Population http://www.poodwaddle.com/clocks/worldclock APHG – Spring 2013
If we shrank the Earth's population to a village of 100 people,with all of the existing human ratios remaining the same,there would be: 57 Asians 52 females21 Europeans 48 males 8 Africans14 people from the Western Hemisphere (north and south) 30 Christians 6 U.S. citizens holding 70 Non-Christians 60% of the worlds wealth 70 unable to read 1 with a college education80 living in substandard housing1 with their own computer 50 suffering from malnutrition 1 near death 1 near birth Source: Mercy Housing Midwest, Omaha, NE.
Critical Issues in Population Geography • More people are alive today than at any other time in human history. • The world’s population increased at a faster rate during the second half of the 20th century than ever before. • Virtually all population growth today occurs in less developed countries (LDCs)
Key Population Issues Key Issues • Where is the world's population distributed? • Where has the world's population increased? • Why is population increasing at different rates in different countries? 4. Why might the world face an overpopulation problem?
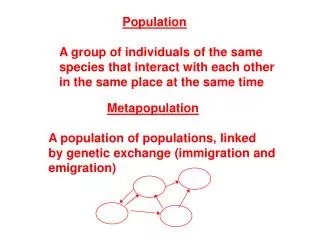
Population Distribution Key Issue 1: Where Is the World's Population Distributed? • Population concentrations • Sparsely populated regions • Population density The scientific study of population characteristics is demography. At a global scale,. .. the world's so-called overpopulationproblem is not simply a matter of the total number of people . . . but the relationship between number of people and available resources. At a local scale, geographers find that overpopulation is a threat in some regions of the world but not in others. Regions with the most people are not necessarily the same as the regions with an unfavorable balance between population and resources.
Distribution of World Population Population concentrations The four largest population clusters (2/3 of world’s population) 1. East Asia – China, Japan, Korean Penn. 2. South Asia – India, Bangladesh, Pakistan, Sri Lanka 3. Southeast Asia – Indonesia, Indochina Penn. 4. Europe – Western Europe, Eastern Europe Other population clusters 1. Northeastern United States 2. Southeastern Canada 3. Western Africa – Half live in Nigeria
World Population Distribution World population is very unevenly distributed across the Earth’s surface and it can be compared to climate distribution.
World Population Cartogram This cartogram displays countries by the size of their population rather than their land area. (Only countries with 50 million or more people are named.)
Population Distribution Sparsely populated regions -The ecumene -People generally avoid: • Dry lands • Cold lands • Wet lands • High lands
Expansion of the Ecumene 5000 B.C.–A.D. 1900 The ecumene, or the portion of the Earth with permanent human settlement, has expanded to cover most of the world’s land area.
World Population Distribution by Region 1800–2050
Population Density • Arithmetic Density – the total number of people divided by the total land area ( This measure is also called population density.) Arithmetic density enables geographers to make approximate comparisons of the number of people trying to live on a given piece of land in different regions of the world. • There is no relationship between arithmetic density and standard of living.
Arithmetic Population Density Arithmetic population density is the number of people per total land area. The highest densities are found in parts of Asia and Europe.
Effect of Migration on Population Growth Q&A. How densely populated is the planet? • 1st Western Europe, 433 people per sq. mile • 2nd Caribbean, 417 people per sq. mile • Least densely settled region is Oceania: 10 people per sq. mile • United States is 78 people per sq. mile Q. Does high density in urbanized areas equal environmental degradation????
Population Densities, 2003 Region Pop./Sq. Mile World 122 Caribbean 417 More Developed Countries 61 South America 52 Less Developed Countries 160 Asia 312 Africa 74 Western Asia 112 Sub-Saharan Africa 76 South Central Asia 376 Northern Africa 57 Southeast Asia 313 Western Africa 108 East Asia 334 Eastern Africa 107 Europe 82 Middle Africa 41 Northern Europe 141 Southern Africa 49 Western Europe 433 North America 42 Eastern Europe 41 Latin America 68 Southern Europe 288 Central America 150 Oceania 10 Source: Population Reference Bureau, 2003 World Population Data
Physiological Density • A more meaningful population measure is by looking at the number of people per area of a certain type of land in a region. • The number of people supported by a unit of arable land is called the physiological density. • Comparing physiological and arithmetic densities helps geographers to understand the capacity if the land to yield enough food for the needs of people.
Physiological Density Physiological density is the number of people per arable land area. This is good measure of the relation between population and agricultural resources in a society.
Agriculture Density • Two countries can have similar physiological densities, but they may produce different amounts of food because of different economic conditions. Agriculture density is the ratio of the number of farmers to the amount of arable land. • The Netherlands has a much higher physiological density than does India but a lower agriculture density. • Agriculture density is directly related to standard of living
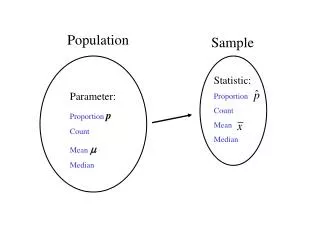
Distribution of World Population Growth Key Issue 2: Where has the World’s Population Increased? • Natural Increase – the percentage by which a population grows in a year • Crude birth rate (CBR) – the number of births per 1,000 population • Crude death rate (CDR) – the number of deaths per 1,000 population • Doubling time – the number of years needed to double a population
World Population Growth1950–2010 Total world population increased from 2.5 to 6 billion in this half century. The natural increase rate peaked in the early 1960s and has declined since, but the number of people added each year did not peak until 1990.
World Population Growth, 1750–2150 Source: United Nations, World Population Prospects, The 1998 Revision; and estimates by the Population Reference Bureau. http://www.youtube.com/watch?v=9_9SutNmfFk&feature=BF&list=ULadYPZ59_AUc&index=1
Natural Increase Q&A: When could world population stop growing? • First one – half million years: the population growth rate was about zero • 1700s modern era of population growth began • Between 1850 and 1900, the annual growth rate reached 0.5 percent • By the mid-1960’s rate surged to 2.0 percent • Dropped to 1.7 percent by the mid-1980s, and declined to about 1.4 percent by 2000.
Natural Increase Rates The natural increase rate (NIR) is the percentage growth or decline in the population of a country per year (not including net migration). Countries in Africa and Southwest Asia have the highest current rates, while Russia and some European countries have negative rates.
Crude Birth Rates The crude birth rate (CBR) is the total number of births in a country per 1,000 population per year. The lowest rates are in Europe, and the highest rates are in Africa and several Asian countries.
Crude Death Rates The crude death rate (CDR) is the total number of deaths in a country per 1,000 population per year. Because wealthy countries are in a late stage of the demographic transition, they often have a higher CDR than poorer countries.
Total Fertility Rates The Total fertility rate (TFR) is the number of children an average woman in a society will have through her childbearing years. The lowest rates are in Europe, and the highest are in Africa and parts of the Middle East.
Infant Mortality Rates The infant mortality rate is the number of infant deaths per 1,000 live births per year. The highest infant mortality rates are found in some of the poorest countries of Africa and Asia.
World Infant Mortality Rates in Selected Countries, 2000 Source: Carl Haub and Diana Cornelius, 2000 World Population Data Sheet (Washington, DC: Population Reference Bureau, 2000).
Life Expectancy at birth Life expectancy at birth is the average number of years a newborn infant can expect to live. The highest life expectancies are generally in the wealthiest countries, and the lowest in the poorest countries.
Doubling Time • Doubling Time of a population (years) : • 70 / Population Growth Rate (%) ( 70 / 2.0% = 35 years ) • Rule of 70 :determine how long it would take for a population to double at its present growth rate. • divide 70 by the population’s annual growth rate to determine the years needed to double the size of the population.
Why has the worlds population grown at such different rates throughout history? 3 variables: births, deaths, and migration Balancing Equation: A. The difference between births and deaths in a population produces the natural increase(or decrease) of a population. B. Net migration is the difference between the number of persons entering a geographic area (immigrants) and those leaving (emigrants) C. Natural increase usually accounts for the greatest amount of growth in a population, especially within a short period of time.
Population increases at different rates Key Issue 3: Why is population increasing at different rates in different countries? • The demographic transition model • Population pyramids • Countries in different stages of demographic transition • Demographic transition and world population growth
Demographic Transition Model: Development & Population Intersect…
Demographic Transition Stage 1: Early Stationary Stage • Population growth: slow increase • Birth rates: high • Death rates: high Most of humanity’s several-hundred year occupancy of Earth was characterized by stage 1. Birth and death rates varied considerably from one year to the next and from one region to another, but over the long term they were roughly comparable, at very high levels. Between 8000 B.C. and A.D. 1750, Earth’s human population increased from 5 million to 800 million. The burst of population growth around 8000 B.C. was caused by the agriculture revolution. Despite the agriculture revolution, the human population remained in stage1 of the demographic transition because food supplies were unpredictable.
Demographic Transition Stage II: Early Expanding Stage • Birth rates: high • Death rates: decreasing • Population growth: rapid and increasing After around A.D1750 the world’s population suddenly began to grow10 times faster than in the past. In stage II, the crude death rate plummets, while the crude birth rate remains the same as in stage I. Most African countries are still in a stage II. With the advent of the Industrial Revolution and the improvements in technology, population growth rate changed. Countries in Europe and North America entered stage II of the demographic transition about 1800, but stage II did not diffuse to most countries in Africa, Asia, and Latin America until the 1950’s. The late 20th century push of countries into stage II was caused by the medical revolution.
Percent of Population under 15 About one-third of world population is under 15, but the percentage by country varies from over 40% in most of Africa and some Asian countries, to under 20% in much of Europe.
Rapid Growth in Cape Verde Cape Verde, which entered stage 2 of the demographic transition in about 1950, is experiencing rapid population growth. Its population history reflects the impacts of famines and out-migration.
Demographic Transition Stage III: Late Expanding Stage • Birth rates: decreasing • Death rates: leveling off • Population growth: rapid but slowing A country moves from a stage II to a stage III when the birth rate begins to drop sharply. European and North American countries moved from stage II to a stage III during the first half of the 20th century. Most countries in Asia and Latin America have moved to a stage III in recent years. A society enters a stage III when people decide to have fewer children. Medical practices introduced in stage II improve the probability of infant survival, but many years pass before families react by conceiving fewer babies.
Demographic Transition Stage III continued…… Economic changes in stage III also induce families to have fewer offspring. Farmers often consider a large family to be an asset. In contrast, children living in cities are generally not economic assets. About 75% of the world’s population is stranded in stages II and III. Q&A: What does improve technology increase? resource availability standard of living health care ? ?
Moderate Growth in Chile Chile entered stage 2 of the demographic transition in the 1930s, and it entered stage 3 in the 1960s.
Demographic Transition Stage IV: Late Stationary Stage • Birth rates: low • Death rates: low • Population growth: low A country reaches stage IV when the birth rate declines to the point where it equals the death rate. The condition is called ZPG. Most European countries have reached stage IV. The United States has moved slightly below ZPG since 2000. When families lived on farms, employment and child rearing were conducted at the same place, but in urban societies parents leave the home to work. Changes in lifestyles also encourage smaller families. Several Eastern European countries, most notably Russia, have negative natural increase rates, a legacy of Communist rule.