Download
1 / 42
420 likes | 505 Views
Explore the impact of individual trust beliefs on performance & the hump-shaped relationship. Includes country trust density functions & empirical evidence.

E N D
The Right Amount of Trust Jeff Butler (EIEF) Paola Giuliano (UCLA) Luigi Guiso (EUI & EIEF) Moscow April 5 2010 March 22 2009
The rise of trust Big and pervasive effects of trust • Strongly correlates with GDP per capita and growth (Knack and Keefer; Algan and Cahuc) • Allows firms to grow larger (Shleifer et al.) and institutions to improve their quality (Tabellini) • Raises access to financial markets, increases investment in stocks (Guiso, Sapienza and Zingales; Cole et. al.) • Affects economic and financial transactions across countries (Guiso, Sapienza and Zingales), venture capital investments (Bottazzi and Darin) • Improves managerial practices and firm organization (Bloom et al)
Trust and economic performance • In this literature trust is always good the more the better • Economic performance increases monotonically with trust • Idea (Arrow): trust is a key ingredient in virtually all transactions more exchange more creation of surplus
Questions and Doubts Is it true that trust always generates more surplus? Does it always pay an individual to trust? Old and recent financial scandals may raise doubts that this is actually the case
Our contribution Focus on the link between individualtrust and individual performance Argue performance is hump-shaped in own trust beliefs Very trustworthy individuals will form too optimistic beliefs they trust and trade too much with the risk of being cheated (and this reduces performance) Un-trustworthy individuals will form too conservative beliefs they do not trust and trade too little, loosing profitable opportunities as a result
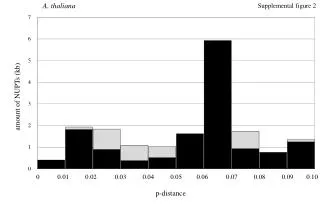
Trust Beliefs: Density Functions by Country High trust Medium trust Low trust Bottom line: massive heterogeneity in beliefs within the same community
Where is persistent heterogeneity coming from? Two explanations: Parents endow children with priors about others and cultural priors are hard to change – e.g. because of confirmation bias (GSZ, 2008; Dohmen et. al. 2007) Parents endow children with values (Bisin and Verdier, 2000, 2001; Tabellini,2009) and people extrapolate beliefs from their own trustworthiness Both values and false consensus are persistent Back with evidence on this later
Outline A simple model tying false consensus and the hump shaped relationship between trust and performance Field data evidence Relationship between trust and performance The relationship between trust and being cheated Experimental evidence Show evidence of culturally driven trust beliefs coupled with the tendency of individuals to extrapolate from their own type Hump shaped performance-trust relation
A simple model • Investor has capital but no ideas • Partner (e.g. an Entrepreneur) has ideas but not capital and he/she can cheat (Dixit, 2003) • E= investor endowment • S= amount the investor lends • f(S) output produced if invest S • πfraction of cheaters in the population • p subjectiveprobability of being cheated Investor’s problem:
Solution The solution with correct beliefs is a level of income: Let’s p the subjective trust belief: An investor’s average income is a concave function of the investor’s trust beliefs, which attains it maximum when the investor’s belief about the share of trustworthy partners, 1-p, equals the true share of trustworthy entrepreneurs, 1-π
Solution: graphics Y Correct belief Too little trust Too much trust 1-π 1 1-p
Predictions • Individual performance should peak at intermediate trust and be lower for very low and very high trust • Peak more to the right in high-trust countries • More trusting people more likely to be cheated • Less trusting people more likely to miss profitable opportunities
Trust, performance and cheating: empirical evidence • Dataset description • Trust and performance • Trust and cheating
Data • European Social Survey (wave 2) • Covers 26 European countries • About 2000 randomly sampled individuals for each country • Standard information on household demographics • Trust “generally speaking, would you say that most people can be trusted, or that you can’t be too careful in dealing with people?” • Score of 0 to 10 • Performance is measured with household total disposable income (only measure available) • 12 categories are available ranging from less than 1800 euros per year to more than 120,000 euros per year • Assign midpoint of range and take logs
Trust and performance: evidence • Regress log income (Y) on 10 trust-level dummies: excluded group lowest trust level • Controls (X): age, education, gender, marital status, parents education, immigrant, employment status • Control for risk tolerance and altruism • Full set of country effects • absorb systematic differences in average actual trustworthiness and any other relevant country-level effect • Full set of regional effects • absorb systematic within country differences in trustworthiness
Does not vanish with experience Trust and income by age
Trust and performance: comments • Unlikely to be driven by reverse causality • If more income generates more trust, can explain rising portion but not falling one • If it implies less trust, can explain falling portion not rising one • Effects economically important: Compared to the pick • A trust of 2 => an income 11 percentage points lower than peak income • A trust of 10=> an income 7 percentage points lower than peak income • Effects of same order of magnitude as returns to high education
Objection 1: In medio stat virtus trust may be picking up unobserved heterogeneity => economic success determined by “moderate attitudes” which happen to be correlated with moderate trust Allow for non-monotonic effects of: Risk tolerance (5 categories) Generosity and loyalty (11 categories) Political preferences (left- right, 11 categories) Religious beliefs (0 to 10) Hump-shaped effect of trust unchanged Only trust and political preferences have a hump shaped relation, but trust robust to political preferences=> does not reflect moderation
Objection 2: Wealthier people more precise info about others’ trustworthiness This implies beliefs are more spread out at low income and less at high income levels generating a hump even when no systematic relation. If so standard deviation of trust negatively correlated with income. But this is not in the data
Digging deeper into mechanism • Too much trust hampers performance because exposes one to: • Larger losses if cheated • Higher chances of being cheated (GSZ) • Too much mistrust hampers performance because causes individuals to miss profit opportunities • We have info on whether and how often individual is cheated, not on missed opportunities Test whether chances of being cheated increase with trust
Data on cheating experience “How often, if ever, have each of these things happened to you in the last five years?” • “A bank or insurance company failed to offer you the best deal you were entitled to” • “A plumber, builder, car mechanic or other repair person overcharged you or did unnecessary work” • “You were sold food that was packed to conceal the worse bits ” • “You were sold something second-hand that quickly proved to be faulty” 1 Never; 2 Once; 3 Twice; 4 3 or 4 times; 5 5 times or more
Cheating distributions Bank/insurance Second hand Plumber, mechanic Food
Trust and cheating: problem • Problem when testing effect of trust on chances of being cheated: people learn and if cheated revise prior downwards • Learning biases towards finding a negative relation • Account for this with IV. Rely on false consensus and obtain proxies for own trustworthiness: • Amount of delegation that is granted by his\her boss at work • a) freedom to organize daily work; b) power to influence decisions about activities of the organization; c) freedom to choose pace of their work • Construct a single index of trustworthiness taking the mean of the delegation on the there domains • Under FC: higher trustworthiness => higher trust • Being cheated is private information and thus unobserved by one’s boss => delegation orthogonal to error
Cheating: model • Measurement issues: • Those mistrusting more likely to report because more alerted and more likely to detect cheating => bias towards finding a negative correlation: IV also accounts for this unobserved heterogeneity • What is cheating may vary across subjects/cultures=> country and regions FE can take care of this
Trust & cheating: effects A one SD increase in trust: • Raises the N. of times one is cheated by a plumber by 1.7 times the sample mean and that when buying second hand by 65% • Increases N. of times one is cheated when buying food byas much asthe samplemean • Triples N. of times one is cheated by a bank
Immigrants, persistence and learning • Exploit information on country of origin of immigrants and variation in trust across countries of origin • Immigrants from high trust countries more likely to be cheated than immigrants from low trust countries • Exclude reverse causality due to beliefs revision • Effect should be stronger for the first generation and for recent immigrants compared to immigrants who arrived further in the past
Persistence: the evidence Freeing oneself from FCE can take as long as one generation
Persistence: the evidence Effect stronger among new arrivals (less than 20 years)
Evidence from a trust game Perform a trust game experiment on a sample of 124 college students Subjects play repeatedly At each round they are randomly assigned either the role of sender or that of receiver => we can measure Their behavioral trust (when they plays as senders) Their trustworthiness (when they play as receivers) Their trust beliefs (expectations about average amounts returned) at each round Independent information, prior to the experiment, on the effort parents put in teaching trustworthiness as a value to their kids
Own and expected trustworthiness Distribution of initial trustworthiness Distribution of trust beliefs • Massive heterogeneity in pure beliefs • Massive heterogeneity in trustworthiness • Are the two correlated? => False consensus
Where is initial trustworthiness coming from? Initial trustworthiness on “good values”
Trust beliefs and performance in the experiment • Hump shape confirmed in on line experiment => rule out reverse causality and heterogeneity in trustworthiness of pool one interacts with • Senders with correct beliefs make 20% more income than those with either too low or too high trust
Conclusion Miscalibrated trust beliefs can be individually costly Costs can be substantial: Our estimates: losses entailed by poorly calibrated beliefs are as important as returns to education Is it better to exceed in trust or to mistrust? Both excesses are individually costly, but exceeding in mistrust is individually more costly than exceeding in trust Mistrust also socially costly as it reduces the creation of surplus Exceeding in trust, while costly to the individual, may be beneficial to society as it promotes surplus creation. Reconciles hump-shaped relation in individual data and monotonically increasing relation in aggregate data