Download
1 / 17
170 likes | 268 Views
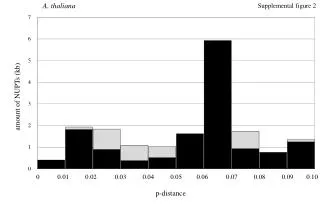
Evaluating the amount of NUPTs (kilobases) and p-distance in Supplemental Figure 2. Study the genomic changes with different NUPT amounts and genetic distances represented by p-values using robust analysis techniques.

E N D
Supplemental figure 2 amount of NUPTs (kb) 0 0.01 0.02 0.03 0.04 0.05 0.06 0.07 0.08 0.09 0.10 p-distance
Supplemental figure 2 amount of NUPTs (kb) 0 0.01 0.02 0.03 0.04 0.05 0.06 0.07 0.08 0.09 0.10 p-distance
Supplemental figure 2 amount of NUPTs (kb) 0 0.01 0.02 0.03 0.04 0.05 0.06 0.07 0.08 0.09 0.10 p-distance
Supplemental figure 2 amount of NUPTs (kb) 0 0.01 0.02 0.03 0.04 0.05 0.06 0.07 0.08 0.09 0.10 p-distance
Supplemental figure 2 amount of NUPTs (kb) 0 0.01 0.02 0.03 0.04 0.05 0.06 0.07 0.08 0.09 0.10 p-distance
Supplemental figure 2 amount of NUPTs (kb) 0 0.01 0.02 0.03 0.04 0.05 0.06 0.07 0.08 0.09 0.10 p-distance
Supplemental figure 2 amount of NUPTs (kb) 0 0.01 0.02 0.03 0.04 0.05 0.06 0.07 0.08 0.09 0.10 p-distance
Supplemental figure 2 amount of NUPTs (kb) 0 0.01 0.02 0.03 0.04 0.05 0.06 0.07 0.08 0.09 0.10 p-distance
Supplemental figure 2 amount of NUPTs (kb) 0 0.01 0.02 0.03 0.04 0.05 0.06 0.07 0.08 0.09 0.10 p-distance
Supplemental figure 2 amount of NUPTs (kb) 0 0.01 0.02 0.03 0.04 0.05 0.06 0.07 0.08 0.09 0.10 p-distance
Supplemental figure 2 amount of NUPTs (kb) 0 0.01 0.02 0.03 0.04 0.05 0.06 0.07 0.08 0.09 0.10 p-distance
Supplemental figure 2 amount of NUPTs (kb) 0 0.01 0.02 0.03 0.04 0.05 0.06 0.07 0.08 0.09 0.10 p-distance
Supplemental figure 2 amount of NUPTs (kb) 0 0.01 0.02 0.03 0.04 0.05 0.06 0.07 0.08 0.09 0.10 p-distance
Supplemental figure 2 amount of NUPTs (kb) 0 0.01 0.02 0.03 0.04 0.05 0.06 0.07 0.08 0.09 0.10 p-distance
Supplemental figure 2 amount of NUPTs (kb) 0 0.01 0.02 0.03 0.04 0.05 0.06 0.07 0.08 0.09 0.10 p-distance
Supplemental figure 2 amount of NUPTs (kb) 0 0.01 0.02 0.03 0.04 0.05 0.06 0.07 0.08 0.09 0.10 p-distance
Supplemental figure 2 amount of NUPTs (kb) 0 0.01 0.02 0.03 0.04 0.05 0.06 0.07 0.08 0.09 0.10 p-distance