Download
1 / 33
340 likes | 492 Views
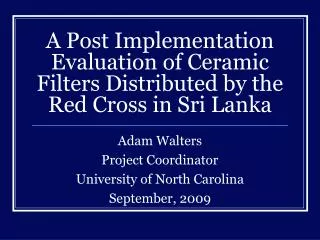
A Post Implementation Evaluation of Ceramic Filters Distributed by the Red Cross in Sri Lanka. Adam Walters Project Coordinator University of North Carolina September, 2009. UNC: Interest in water Waterborne disease Household water treatment Ceramic water filter. Project Description

E N D
A Post Implementation Evaluation of Ceramic Filters Distributed by the Red Cross in Sri Lanka Adam Walters Project Coordinator University of North Carolina September, 2009
UNC: Interest in water Waterborne disease Household water treatment Ceramic water filter Project Description Objectives of Study Timetable of Study Questions and Answers Outline of Presentation
UNC Environmental Microbiology Lab • Dr. Mark Sobsey, Principle Investigator • Dr. Lisa Cassanova, Project Supervisor • Adam Walters, Project Manager • Department of Environmental Sciences School of Global Public Health University of North Carolina • Primary interests in the lab: Safe Water • Fecal pollution and microbial indicators • Point-of-use water treatment
Waterborne Disease: Cause • Ingestion of contaminated water • Fecal contamination Pathogens: • Bacteria (E.coli, Salmonella spp., Shigella spp.) • Viruses (Norovirus, Hepatitis A & E) • Protozoan parasites (Cryptosporidium parvum, Giardia lambia)
How many are at risk? 1.1 billion lack access to an “improved” drinking water supply; many more drink water that is grossly contaminated. How many are getting sick? 4 billion cases of diarrhea occur annually, of which 88% is attributable to unsafe water, and inadequate sanitation and hygiene. How many are dying? 1.8 million people die every year from diarrheal diseases, the vast majority children under 5. How many more cannot escape poverty? Lack of safe water perpetuates a cycle whereby poor populations become further disadvantaged, and poverty becomes entrenched. How much suffering can be prevented? WHO estimates that 94% of diarrheal cases are preventable through modifications to the environment, including through interventions to increase the availability of clean water, and to improve sanitation and hygiene.
Gastroenteritis Waterborne Disease: Effects Limits food and liquid consumption Illness, time spent caring for others Reduced resistance to infection Malnutrition Impaired physical growth & cognitive development Less time for productive activities Long term enteric illness
WSH = disease and poverty? • Time, financial cost • Health care costs • Inadequate water supply • Unsafe water resources • Inequitable access POVERTY
WSH = a motor for development • Improved water supply • Safe water resources • Universal access • Time, financial savings • Averted disease costs • Healthy populations Development
Leading Causes of Deaths from Infectious Diseases 2004 World Health Report
Diarrheal disease reduction from drinking water and sanitation improvements Reduction (%) Source: Fewtrell L et al. Water, sanitation, and hygiene interventions to reduce diarrhoea in less developed countries: a systematic review and meta-analysis.Lancet Infectious Diseases, 2005
Improved Drinking Water: Trends in service levels Un-served Meeting the MDG Drinking Water and Sanitation Target: Mid-term Assessment of Progress WHO and UNICEF, 2004 Other 'improved drinking water source' Piped water at home
Excreta from humans and animals Land Runoff Sewage Solid Waste Landfills Oceans and Estuaries Rivers and Lakes Groundwater Irrigation Shellfish Recreation Water Supply Crops Aerosols Human Waterborne Pathogens Come Primarily from Feces by Various Routes of Exposure Adapted from Charles P. Gerba et al. 1975
The Microbial World: Types and Sizes of Microbes Amebic dysentery Giardiasis ( bever fever) Norovirus Hepatitis A&E Rotaviruses Polio-/enteroviruses Cholera Diarrhea Typhoid fever Dysentery VIRUS ~ 0.1 micron BACTERIUM ~ 1 micron >30microns Helminth (Worm) (eggs shed in feces)
Point of Use (POU) Water Treatment • In many places disease-free, piped water is years away • Ground and surface water sources are often contaminated • POU technology allows people to improve the quality of unsafe water sources by treating it themselves in their own home
Point of Use Water Treatment CDC Safewater: chlorination & safe storage Solar disinfection Ceramic filter Coagulant-flocculant-disinfectant Biosand filter
How does it work? • Removes biological pathogens from contaminated water. • Size Exclusion • Small pores in the ceramic body remove 99% of bacteria in contaminated water • Silver Deactivation • Silver has strong antimicrobial properties • By impregnating the filter with colloidal silver, the effectiveness of bacterial removal is increased to 99.98% • User friendly • With 1-3 fillings, it provides 20-30 L of safe drinking water each day . • Easy to use properly and to maintain.
Ceramic filter element Contaminated water Spigot Water receptacle Safe drinking water How does it work?
26 cm 19 cm The filter resembles a standard flower pot, and holds around 10 liters. When full, the filter has a filtration rate of between 1 and 3 liters per hour. This rate of filtration generates enough safe water to sustain a six member family.
The pores of the filter can be seen in this sliced image. The zig-zag arrows illustrate how the water passes through the ceramic body.
Pores Pathogen Ag+ (silver) particles Schematic Diagram This diagram illustrates size exclusion (first click when pathogen stops), and bacterial inactivation (second click).
Household Water Containers for Safe Storage: • Material: Depends on use; easy to clean; lightweight, durable, impact + oxidation resistant • High-density polyethylene (HDPE) Transparent beverage bottles for solar-UV + heat (PET) • Black or opaque for solar-heat only • Can adapt traditional vessels to safer storage • Add cover • Add spout or spigot
Project Overview • A cross-sectional study of households that originally received filters to determine the number of households still using the filter, as well as factors associated with filter use and disuse • A use effectiveness and water quality assessment to measure the microbiological effectiveness of the filters and the stored filtered water
Timeline of Study • Staff training and preparation: 2 weeks • September and October • Recruitment of households: 4 weeks • October and November • Cross sectional survey: 5-8 weeks • November and December
Stage 1: Recruitment • Recruit approximately 440 households in communities that were given CWFs after the tsunami. • Recruitment criteria: • A family or other household communal unit that received a CWP through the implementation program • A family or other household communal unit still living at the same location where they received the filter • Voluntary willingness to participate in the survey.
Stage 1: Recruitment Consent: 1) During the visit the surveyor will introduce the study to the household 2) If the household accepts participation the consent form will be explained and signed. 3) A water sample will be taken from the filter if they are still using it
Stage 2: Survey • Second Visit: • Survey is given (approximately 45 minutes, 116 questions) • Water sample is taken • Hygiene pack is given • If no one is available for the survey the visit must be rescheduled
Stage 3: Finalization • Return to missing households • All of the households that were unavailable for an interview in stage 2 must be revisited • Finalization of data entry and laboratory work
Thank you and Questions Thank you all for attending our orientation conference, and for supporting our project Special thanks to those who have helped begin the project here Galle: UNC Faculty and Staff: Dr. Mark Sobsey, Dr. Lisa Cassanova, Mr. Doug Wait American Red Cross: Mr. Dan Finan, Mr. Roshan, Mr. Mahesh & Mr. Marcus Bolleurs, Ms. Subathini