Download
1 / 33
340 likes | 373 Views
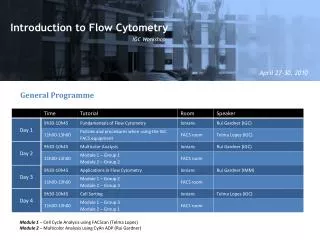
Steps to Success with Multicolor Flow Cytometry. Holden T. Maecker. Outline. Configure your instrument Characterize your instrument Design your panel Optimize settings for your panel Run appropriate controls QC your data. Outline. Configure your instrument Number and type of lasers

E N D
Steps to Success withMulticolor Flow Cytometry Holden T. Maecker
Outline • Configure your instrument • Characterize your instrument • Design your panel • Optimize settings for your panel • Run appropriate controls • QC your data
Outline • Configure your instrument • Number and type of lasers • Number of PMTs per laser • Choice of filters and dichroic mirrors • These choices will determine: • What fluorochromes you can use effectively • How well certain fluorochrome combinations will perform
W1 W2 How do we measure performance? Resolution Sensitivity: D Stain Index = D / W Where D = difference between positive and negative peak medians, and W = 2 x rSD (robust standard deviation)
CD127 PE 40 35 30 25 mW green laser (532 nm) 25 100 mW blue laser (488 nm) Stain index 20 25 mW blue laser (488 nm) 15 10 5 0 300 400 500 600 700 PMT voltage An Example: Green vs. Blue Lasers • Green laser more efficient for PE and PE tandems • Green laser less efficient for FITC, PerCP and GFP
Outline • Characterize your instrument • Obtain minimum baseline PMT settings • Track performance over time • This will allow you to: • Run the instrument where it is most sensitive • Be alert to changes in the instrument that might affect performance
Automated baseline PMT voltage determination in Diva 6.0 Baseline PMTV is set by placing the dim bead MFI to equal 10X SDEN 460 V SDEN
FITC Channel (Blue laser) 550 525 500 PMT Voltage 475 450 425 400 10/22/04 11/11/04 12/01/04 12/21/04 01/10/05 01/30/05 02/19/05 03/11/05 Time Performance Tracking • A variety of parameters can be tracked: • Linearity, CVs, laser alignment • PMT voltages required to hit target values • Data can be visualized in Levey-Jennings plots:
Outline • Design your panel • Reserve brightest fluorochromes for dimmest markers and vice versa • Avoid spillover from bright populations into detectors requiring high sensitivity • Beware of tandem dye issues • Titrate antibodies for best separation • This will allow you to: • Maintain resolution sensitivity where you most need it • Avoid artifacts of tandem dye degradation
Spillover affects resolution sensitivity Without CD45 AmCyan: With CD45 AmCyan: CD19 FITC Note that this is only an issue when the two markers (CD45 and CD19) are co-expressed on the same cell population.
Special requirements of tandem dyes • Compensation requirements for tandem dye conjugates can vary, even between two experiments with the same antibody • Degrade with exposure to light, temperature, and fixation • Stained cells are most vulnerable • Solutions: • Minimize exposure to above agents • Use BD stabilizing fixative if a final fix is necessary • Run experiment-specific compensation
False positives due to tandem degradation A. With CD8 APC-Cy7 and CD4 PE-Cy7: Gating scheme CD8 APC-Cy7+ cells CD4 PE-Cy7+ cells False positives in APC channel reduced in absence of APC-Cy7 False positives in PE channel remain B. Without CD8 APC-Cy7:
CD4 APC-Cy7 CD8 APC-Cy7 CD4 APC-H7 CD8 APC-H7 New tandems can be more stable • APC-H7 as a replacement for APC-Cy7: Comparison of Sample Stability (in BD Stabilizing Fixative at RT) 250 200 150 % Spillover 100 50 0 0 1 2 4 6 8 24 48 Hours of light exposure
Antibody titration basics • For most purposes, the main objective is to maximize signal:noise (pos/neg separation) • This may occur at less than saturated staining • This may or may not be the manufacturer’s recommended titer • Titer is affected by: • Staining volume (e.g., 100 mL) • Number of cells (not critical up to ~5x10⁶) • Staining time and temperature (e.g., 30 min RT) • Type of sample (whole blood, PBMC, etc.)
Outline • Optimize settings for your panel • Derive experiment-specific PMT settings • Run compensation controls for each experiment • This will allow you to: • Use settings most appropriate for your panel • Avoid gross errors of compensation
Experiment-specific setup for a new panel • Set voltages to achieve baseline target values • Run single-stained CompBeads to see if each bead is at least 2x brighter in its primary detector vs. other detectors • If not, increase voltage in the primary detector (beware: potential reagent problem) • Run fully-stained cells and: • Decrease voltages for any detectors where events are off-scale • Increase voltages for any detectors where low-end resolution is poor (theoretically should not be necessary) • Re-run single-stained CompBeads and calculate compensation • Re-run fully-stained cells and repeat step 3 (if further changes made, re-run compensation) • Save experiment-specific settings as target values • Run samples
Experiment-specific setup for existing panel • Set voltages to achieve experiment-specific target channels • Run single-stained CompBeads and calculate compensation • Run samples
Outline • Run appropriate controls • Instrument setup controls (e.g., CompBeads) • Gating controls (e.g., FMO) • Biological controls (e.g., unstimulated samples, healthy donors) • This will allow you to: • Obtain consistent setup and compensation • Gate problem markers reproducibly • Make appropriate biological comparisons and conclusions
CompBeads as single-color controls • CompBeads provide a convenient way to create single-color compensation controls: • Using the same Abs as in the experimental samples • Creating a (usually) bright and uniform positive fluorescent peak • Without using additional cells
Frequent compensation questions • Do I need to use the same antibody for compensation as I use in the experiment? • Yes, for certain tandem dyes (e.g., PE-Cy7, APC-Cy7) • Are capture beads better than cells for compensation? • Usually, as long as the antibody binds to the bead and is as bright or brighter than stained cells • Should compensation controls be treated the same as experimental samples (e.g., fixed and permeabilized)? • Yes, although with optimal fix/perm protocols this may make little difference
Consider using lyophilized reagents • Lyophilization provides increased stability, even at room temperature or 37oC • One batch of reagents can be used for an entire longitudinal study • Pre-configured plates can avoid errors of reagent addition • Complex experiments (multiple stimuli, multiple polychromatic staining cocktails) become easier • Lyophilized cell controls can provide run-to-run standardization
Outline • QC your data • Visually inspect compensation • Visually inspect gating • Set sample acceptance criteria • This will allow you to: • Avoid classification errors and false conclusions due to improper compensation and/or gating, or sample artifacts
Visually inspect compensation • Create a template containing dot plots of each color combination in your experiment, then examine a fully stained sample for possible compensation problems • Yikes!
Visually inspect gating • Check gating across all samples in the experiment • Gates may need to be adjusted across donors and/or experimental runs; dynamic (e.g., snap-to) gates may help in some cases IFNg FITC IL-2 PE
Types of sample acceptance criteria • Minimum viability and recovery for cryopreserved PBMC • Minimum number of events collected in an appropriate gate (e.g., lymphocytes) • Minimum number of events within a region of interest, to calculate an accurate percentage
Outline • Configure your instrument • Characterize your instrument • Design your panel • Optimize settings for your panel • Run appropriate controls • QC your data
A question for you to answer How many colors can you combine and still have robust results? This depends on: -The experimental question -The instrument used -The markers to be combined
References • Maecker, H. T., Frey, T., Nomura, L. E., and Trotter, J. 2004. Selecting fluorochrome conjugates for maximum sensitivity. Cytometry A 62:169. • Maecker, H. T., and Trotter, J. 2006. Flow cytometry controls, instrument setup, and the determination of positivity. Cytometry A 69: 1037. • Roederer, M. 2008. How many events is enough? Are you positive? Cytometry A 73: 384-385. • McLaughlin, B. E., N. Baumgarth, M. Bigos, M. Roederer, S. C. De Rosa, J. D. Altman, D. F. Nixon, J. Ottinger, C. Oxford, T. G. Evans, and D. M. Asmuth. 2008. Nine-color flow cytometry for accurate measurement of T cell subsets and cytokine responses. Part I: Panel design by an empiric approach. Cytometry A 73: 400-410.
Acknowledgements • Laurel Nomura • Margaret Inokuma • Maria Suni • Maria Jaimes • Smita Ghanekar • Jack Dunne • Skip Maino • Joe Trotter • Dennis Sasaki • Marina Gever