Download
1 / 11
110 likes | 271 Views
When Non-Significance Maybe Significant: Lessons Learned from a Study into the Development, Implementation and Evaluation of a Risk Assessment Tool for Fleet Settings. Authors: Wishart, D., Freeman, J., Davey, J., Wilson, A., Rowland, B. Presented by Dr. James Freeman

E N D
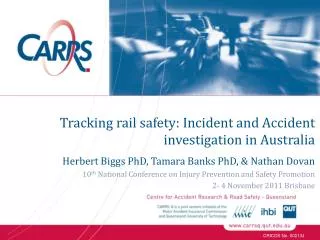
When Non-Significance Maybe Significant: Lessons Learned from a Study into the Development, Implementation and Evaluation of a Risk Assessment Tool for Fleet Settings Authors: Wishart, D., Freeman, J., Davey, J., Wilson, A., Rowland, B. Presented by Dr. James Freeman International Conference of Driver Behaviour and Training, Paris 29-30 November 2011 CRICOS No. 00213J
Introduction (1) • This study reports on the development of a self report assessment tool to increase the efficacy of crash prediction within Australian Fleet settings • Over last 20 years an array of measures have been produced • (Driver anger scale, Driving Skill Inventory, Manchester Driver Behaviour Questionnaire, Driver Attitude Questionnaire, Driver Stress Inventory, Safety Climate Questionnaire)
Introduction (2) • While these tools are useful, research has demonstrated limited ability to accurately identify individuals most likely to be involved in a crash. • Reasons cited include; • Crashes are relatively rare • Other competing factors may influence crash event • Ongoing questions regarding the validity of self report measures (common method variance etc) • Lack of contemporary issues relating to fleet driving performance
Aims • Identify contemporary driving issues for professional drivers (via focus groups) which has previously been published (refer Wishart, Davey, Freeman, and Rowland, 2009); • Develop a self report risk assessment tool that is designed to increase the efficacy of crash prediction within Australian fleet settings; and • Pilot and evaluate the assessment measure on a sample of professional drivers to determine its efficacy in predicting self report crashes.
Methodology • Phase one • focus groups to identify issues influencing driving behaviour in Australian work settings • (217 participants, 160 males, 57 females) • Phase two • Questionnaire Development • Issues identified in phase one • Previous research in this current program of research • Administration of Questionnaire • (546 participants, 246 males 300 females)
Results (Factor analysis) Factor analysis identified 9 factors (speeding & aggression – traditional DBQ)
Results (Frequency of behaviours) Three highest ranked negative behaviour items • I regularly overtake slow drivers rather than sit behind them (M=3.72, SD= 1.43) • I regularly drive a few kms an hour over the speed limit on the highway (M=3.39, SD= 1.52) • I regularly find myself driving on “autopilot” on the way home from work (M= 3.01, SD= 1.44) • Three highest ranked positive items • I pullover before answering/making mobile phone calls (M= 4.75, SD= 2.06) • I drive to the speed limit no matter how much I am running late (M= 4.47, SD= 1.82) • I regularly check my fluid levels and tyre pressure between scheduled servicing (M= 3.71, SD= 1.95)
Results (Inter-correlations) • Contrast to previous research • No significant difference driver’s age and kilometres travelled • No significant drivers age and frequency self reported crashes • Consistent with previous research • Age significant negative relationship to speeding, aggression, time pressure, distraction, casualness, fatigue • Significant positive relationship kilometres travelled and all factors except awareness
Results (prediction of crashes & offences) • Series of logistic regression analyses performed to determine identified factors predictive of self report crashes and offences work related and non work related. • Overall model significant in some cases but.... No more than 8% of crashes, 3% of offences, 10% minor damage incidents
Discussion • No factors were predictive of crash involvement either for work or personal driving. • Kilometres travelled did not improve prediction of crashes. • Concerns remain as to the reliability of self report measures & self report bias • Although there may be benefits to utilising crash databases these can also contain biases (what is defined as a crash) • Concerns over potential publication biases primarily publishing statistically significant results
Mark your Diaries! International Occupational Safety in Transport Conference September 2012, Gold Coast.