Download
1 / 48
490 likes | 694 Views
Pawan Harish PhD. Guide: Prof. P.J.Narayanan. Computational Displays On Enhancing Displays using Computation. What’s the need?. Displays have many limitations today: Low Intensity Resolution Maximum of 5M pixels – Apple’s Retina display Displaying and Rendering More Pixels

E N D
Pawan Harish PhD. Guide: Prof. P.J.Narayanan Computational DisplaysOn Enhancing Displays using Computation
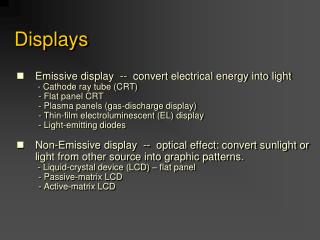
What’s the need? • Displays have many limitations today: • Low Intensity Resolution • Maximum of 5M pixels – Apple’s Retina display • Displaying and Rendering More Pixels • Graphics cards cannot render very large resolutions • Low Refresh Rate • Maximum 240Hz using Samsung Blue Phase • Planarity • Nearly all displays are planar • Lack of 3D viewing • Very few examples of 3D displays exist • Lack of Interaction • Getting more attention but still far from being natural
Market Solutions and Future Trends • Market uses a direct (brute force) approach which needs ever new technologies (which are hard to come by) to push the display design. • Direct methods can only go as far as the technology and feasibility allows them. • Intelligent use of display technology is needed without depending too much on physical, chemical and metallurgical means. High Dynamic Range Display by BrightSide 4K Sony Projector Sony’s 3D display
Computational Displays • Computation today is cheap and abundantly available. • Using computation to enhance systems has been tried with success in many domains such as computational photography, computational biology, etc. • The concept is to get more out of a base system using algorithmic modifications along with prior knowledge about the system. • We extend the notion of algorithmic modification to displays and propose to enhance displays using computation. • We call such displays Computational Displays. • These displays enhance capabilities of current displays by careful use of computation.
Hypothesis and Scope • Hypothesis: • Computation, if used intelligently along with other methods, can compensate for many of the display shortcomings. • Scope: • The systems proposed in this thesis use standard hardware along with computation to enhance displays. • We focus is on intra display processes - where multiple conventional displays are used in order to gain more out of a system. • Limited inter-display processes without hardware modification is also explored.
Computational Displays as a Subject • There are two ways in which computation can enhace display capabilities • Hardware Modifications: • Creates specialized hardware that is used in conjunction with computation to solve the specific display problem • Examples: Tensor Displays, Wobulation, Content Adaptive resolution enhacement etc. • Algorithmic Modifications • Treats displays as black boxes • We use this line of thought in this thesis. • Examples: FTVR, Object appearance editing, Display Walls etc.
Related Work: Hardware Modifications • Intra Display Interactions • Positive: Fast and Efficient • Negative: Costly, Non-Sclable,Technology dependent, Limited applicability, Requires specialized content.
Related Work: Algorithmic Modifications • Inter Display Interactions • Positive: Cheap, Sclable,Technology independent, Larger applicability, Uses conventional content. • Negative: Slower, but acceptable with enough computation. Usually requires more input parameters.
What We Explore and Why • Focus+Context, spatial resolution • Many visualization application require both focus and context in a scene (medical, astronomical data etc.) • Creating a large single display is very expensive • Many people have asked us for the code of our project: Bio, Topology, Physics. There is a need for such a display. • Non-Planar displays • Interactive views in physical space is more immersive and fun. • New motion capture methods are wasted with flat displays. • High Dynamic Range display • There are ways to capture HDR (12 bit cameras), but hard to display. • Very few examples of HDR displays exist Physical Processes Complexity These are a set orthogonal fundamental display problems with varying physical processes. Showing solutions in these dimensions validates our hypothesis by example.
The Approach User Input Need to devise a generic framework on how to enhance displays using computation COMPUTATIONAL DISPLAY IMAGE GENERATION ALGORITHMS Sub-Image Generation Conventional Display IMAGE AGGREGATION - Physical Processes (Arrangement/ Optics/ Inverse mapping/ Mixing) Standard Content Load Distribution (Single/ Distributed/ Parallel) • Sub-Image Generation Conventional Display User Conventional Display • Sub-Image Generation • Sub-Image Generation Conventional Display • Prior Knowledge • (Mapping)
View Dependent Multi-Planar Displays Pawan Harish and P.J.Narayanan 1. IEEE Transactions on Visualization and Computer Graphics, 2013 2. SIGGRAPH Virtual Reality Continnum and its Applications in Industry, 2009
View Dependent Rendering View Dependent Triangle Sorting Architectural Design Dynamic Scene View Dependent Facet Rendering Display Geometry Depth Correcting Shaders Quilt Image Rendering Per Facet VBO Head Tracker Predefined Image Mapping, Yi Quilt Image N Quilt Image 2 Quilt Image 1 of all Facet Images Rendered Display
As a Computational Display User Input MILTIPLANAR DISPLAY AS A COMPUTATIONAL DISPLAY • Physical Processes Involved: Viewer’s head position, Display Geometry, Facet Orientation, Display W.R.T. Viewer. • Algorithmic Modifications: Homography, Parallel Culling and Rendering. Homography Transformation and Quilt Image Rendering IMAGE GENERATION ALGORITHMS Display Facets – LCD, Projected Standard Content Physical facet arrangement as described by input Display Configuration • Sub-Image Generation Conventional Display Parallel Scene Culling and triangle Sorting User Conventional Display • Sub-Image Generation • Sub-Image Generation Conventional Display • Prior Knowledge • (Mapping)
C1 Observing plane Rendering approach Distance d from Ci Virtual Plane Multiplanar Display Cv • Homography can be used to pre-warp facet images to generate corrective image on virtual plane • Can lead to depth errors – we fix these using per-pixel operations in a pixel shader. Normal n in Ci Frame Display Facet Camera Ci Camera Cv [R|T] to Camera Ci Viewer Camera Problems: Pixel Interpolation, Non-integer Pixles and Per-Pixel Normalization Pixel Shader H V Pd P Mv H C2 C3 Homography Viewport Scaling Perspective Division Projection ModelView Homography Canonical Space [-1,1]
Quality Evaluation Only our method produces consistent values across the facet boundaries, ensuring consistent collective rendering. Visual difference between the two methods. Clearly PTM produces more errors, even at 16 times the image size Scale <1 Raskar Our Method CAVE Comparision with other approaches Comparision with Projective Texture Mapping
Scalability: Parallel GPU ∆ Sorting and Single Pass Quilt Rendering Finding Triangles in Each Facet using Ray Casting Y X Each Facet has a Different Projection Matrix Pre-Warp triangles in each facet to render all in a single pass Ix = V Pd HxPMv[3D] Z TEST#1 Output TEST#2 Ix = V Pd I I{HxPMv[3D]} IQuilt= VPd II∑x{YxHxPMv[3D]}
Experimental Evaluation Spherical display shows better interaction as opposed to an LCD Our system perform nearly 7-10 times faster.
View Dependent Parametric Displays Pawan Harish and P. J. Narayanan Joint Virtual Reality Conference of EuroVG-EGVE, 2011
Approach and Problems Tracked Viewer Camera Virtual Plane Wrapped Texture Display Parametric form Fixed Texture Coordinates
As a Computational Display User Input PARAMETRIC DISPLAY AS A COMPUTATIONAL DISPLAY • Physical Processes Involved: Viewer’s head position, Display W.R.T viewer, display surface equation and texture coordinates • Algorithmic Modifications: Fully Parallel, Vertex and Triangle processing on S.M. 5.0. IMAGE GENERATION ALGORITHMS Per Vertex ray casting to adjust individual vertices on the base texture • Non- Conventional Display, sphere etc., emulated using Conventional Technologies - LCD. Projectors. Standard Content Un wrapping the base texture image to display geometry Parallel per-triangle geodesic distance computation and subdivision User • Sub-Image Generation • Sub-Image Generation • Prior Knowledge • (Mapping)
Background: SM 5.0 And DX 11 DirectX 11 and Shader Model 5.0 Tessellation hardware can be used to generate triangles. We use this to approximate Non Linear Rasterization.
Simulating Non-Linear Rasterization on DX11 Hardware • Set tessellation parameters based in threshold and triangle projection on the surface • Triangle Projection using per-vertex ray-casting • Compute geodesic edge length and divide by threshold to get TesslevelOuter parameter • Set TesslevelInner as Max(TesslevelOuter[1:3]) 4. Set TesslevelInner as Maximum of TesslevelOuter 2. Compute Geodesic Edge Length – We use Great Circle Distance for Sphere 3. Divide Edge length by threshold and set TessleveOuter 1. Project Triangle Vertices using per vertex Ray Casting
Simulating Non-Linear Rasterization on DX11 Hardware • Modify mesh based on inverse mapping from surface to the base texture image. • Project newly formed vertices using per-vertex ray casting • Unwrap the intersection point using inverse mapping • Move vertices in the base texture space to compensate for display curvature Base Texture 4. Propagate the motion to the world space 5. Rasterize the modified mesh to generate base texture 1. Project newly formed triangles 2. Unwrap the intersection points using mapping 3. Move vertices in (s,t) to compensate for curvature
Visual Effect : Simulated and Real Without Tessellation With Tessellation Without Tessellation With Tessellation • This method is nearly 20 times faster as compared to multi-planar approach
Spatio Temporal Mixing to Increase Intensity Resolution Pawan Harish, Parikshit Sakurikar, P. J. Narayanan. 1. Indian Conference on Computer Vision, Graphics and Image Processing, 2012 2. CVPR Workshop on Computational Cameras and Displays, 2012 3. Microsoft TechVista ,2013 Our Mehtod Input Image Our Mehtod Input Image
Goal And Approach • Goal: • Increasing color resolution, possibly adding more bits to the already present color on a display. • Simple example: showing grey value on a display by flipping black and white colors • Approach: • We can assume human eye cannot see beyond 30Hz • With high vertical refresh rate of 120Hz, we can show two 60Hz images and mix the colors in viewer eye. • This can show a gery pixel on a black and white display adding 1 addtional bit to the existing display. • Similarly can be done in spatial domain as well • Extending Dithering and Halftoning to dynamic medium
As a Computational Display User Input SPATIO TEMPORAL MIXING AS A COMPUTATIONAL DISPLAY • Physical Processes Involved: Response of the eye with spatially and temporally varying intensities (HVS). Intensities generated by the display (Display Model) • Algorithmic Modifications: Directly Parallel design with a small amount of pre-processing. IMAGE GENERATION ALGORITHMS • Show sub images or sub-pixels by synchronizing with the display clock. Apply temporal and spatial components Arrange sub pixles or sub images in temporal or spatial manner to produce in-between-intensities. • Compute sub images or sub pixels for the input image per pixel in parallel based on local attributes. Compute in real time for videos. Standard Content User Pre-Compute the Intensity map in parallel • Prior Knowledge • (Mapping)
Background: HVS and CRT Models Excitation Curve for kth cycle • Human Visual System: • From a distance, spatial arrangement of pixels produces an average intensity. • Temporally, the visual system can resolve 10 to 12 images per second. • Spatial and temporal perception is non-separable. • Perceivable intensity values for a given luminance is represented by just noticeable difference (JND) steps. • The CRT Model: • Based on the observable values, F(d), and the predicted values T(d) . • A well accepted model for CRT behavior is the gamma correction model Luminescent Intensity Decay Curve for (k-1)thcycle Time
Decomposing High Bit Intensity Into Lower Bit Intensities • The minimum and maximum values of the input image scale (10-bit) maps to the minimum and maximum of the display scale (8-bit) in the high-bit scale map to a sum of lower bit intensities by incrementally increasing one intensity per sub-image as shown in the table.
Single Frame Time Temoral Mixing • We sacrifice vertical refresh rate to gain intensity resolution in this approach. We can divide refreesh into any number of sub-images such that the average of these sub-images produce an intensity not available in the actual display when flipped temporally. • Spatial Component : Consider, the entire screen filled with a single intensity value. Then if all pixels are allotted the same sub-image sequence, the entire screen will change simultaneously resulting in a noticeable flipping artifact. Temporal Average Display Clock The average of sub-image pixel values is perceived by the viewer 1 4 3 Sub Images 2 1
Spatial Mixing 1 2 3 4 • Each pixel may map to a window of 2x2, 3x3 etc. such that the eye may not perceive individual sub-pixels, but treat the group as a single pixel with average of all sub-pixel intensities. When viewed from a distance these sub-pixels average into a single new intensity not available on the base display. • Temopral Component : Temporal mixing help better perceive the average intensity per super-pixel and also differentiates its identity from its neighbors. This is done by rotating the sub-pixel intensities by one for each display clock cycle. Temporal Component To Spatial Mixing
Display Clock Spatio Temporal Mixing High bit Sub Images • Combine both approaches into a single system with weightage given to spatial and temporal components. • Can add a maximum of 4 more bits • HVS cannot differentiate between so many levels as there are more levels than allowable number of JNDs • Camera can see these. Hence can be applied to Vision applications Each sub-image is 2-bit less than the input image. 4 Sub-images are decomposed spatially and flipped temporally to average their intensities 3 2 1
Experimental Results: Camera 10 bit On 8 bit Spatially 10 bit On 8 bit Directly 10 bit On 8 bit Temporally Luminance Curves for Spatial and Temporal Methods Luminance Curve for Spatio-Temporal Method 11 bit On 8 bit Spatio-Temporally 11 bit On 8 bit Directly
Experimental Results: Humans • The mean error is a good indicatorfor the human perception of 10-bit images. • For the 10-bit images, we see a mean error of 0:8 bands with standard deviation of 0:76 over all subjects. • Our methods produced a low error and were capable of displaying more intensities to a human observer
Garuda: A scalable tiled display wall using commodity PCs Nirnimesh, Pawan Harish, P. J. Narayanan 1. IEEE Transactions on Visualization and Computer Graphics, 2007 2. Indian Conference on Computer Vision, Graphics and Image Processing, 2006
Too many; very low level Intercept OpenGL Distribute The Garuda System • Scalability Poblems • To arbitrarily large displays • To arbitrarily large environment models • Issues: Network, CPU, Graphics, Software • Both are Easy to use • Application transparency • Automatic rendering from a standard API without modifying application. Application Chromium • Deals with “objects” and not primitives • Server handles the whole scene and sends selected objects to the clients • Low-end clients, commodity network, high-end server, distributed rendering. Scales with size. • Caching exploits temporal coherence
As a Computational Display User Input GARUDA AS A COMPUTATIONAL DISPLAY Client renders its own image based on data received from server IMAGE GENERATION ALGORITHMS Client Display per Tile – LCD, CRT, projector Standard Content Physical arrangement of client tiles withing the display wall • Sub-Image Generation Conventional Display Server Culls the scene and transmits the data to clients User Conventional Display • Sub-Image Generation • Sub-Image Generation Conventional Display • Prior Knowledge • (Mapping) • Physical Processes Involved: The location of each client within the larger display is known based on which culling takes place. • Algorithmic Modifications: Serial Culling. Parallel Rendering and Serial Sync results in Distributed rendering.
Data Transmission and Rendering • Server: • Send visible object list to each client • Serialize OSG nodes of new objects and send to each client • Client: • Assemble partial scene graph; cache objects • Remove objects from cache if full using LRU • Tile-clients start rendering as soon as all objects available • Clients inform server Ready-to-Swap after rendering. • Server asks all clients to swap after all clients inform readiness. • Results in synchronized rendering and minimal display tearing.
Transparent Rendering and Pipelining • No modification to the user’s program. Application isn’t aware it is rendering to a tile. • Makes tiled rendering available to many applications. • All stages of the OSG program are internally pipelined
Experimental Evaluation: Scalability Better client hardware, 6600GT, produce 10 times better results Increasing the size increases rendering speed due to distributed rendering of the system
Conclusions And Future Tangents Don’t get confused by the Maze
Conclusions High (Medium, High) (High, High) • The hypothesis we considered in this thesis was applied to various unrelated problems in display design. • In each, we applied the same framework to come to a problem-specific design. • We explored one niche of the computational displays landscape, one where computation is heavily used in conjunction with simple physical processes. Spatio Temporal Mixing MultiPlanar Displays Physical Pocess Complexity (High, Medium) (Medium, Medium) The ideas we explore in this thesis can be extended on to hardware modifications involving optics, mechanical and metallurgical elements. The underlying design, however, should always respect the role of computation and what can be achieved with it when used intelligently. Garuda Display Wall Parametric Displays Computational Complexity High
Future Areas to Explore • The set of problems explored in this thesis are by no means an exhaustive study of the framework we propose. • They do, however, underline a common theme amongst radically different requirements. • Future work can directly use the computational display framework to explore various other problems in this landscape including: • Increasing the vertical refresh rate of a display. • Increasing spatial resolution using multiple display elements. • Interactive experiences on single or multiple displays. • Touch and interactive gestures on non-planar displays, etc.
Thank You for staying this far Questions? Related Publications: Journal Papers 1. "Designing Prespectively-Correct MultiPlanar Displays", by Pawan Harish and P. J. Narayanan, in IEEE Transactions on Visualization and Computer Graphics, Volume 99, (TVCG) 2012. 2. "Garuda: A Scalable Tiled Display Wall using Commodity PCs", by Nirnimesh, Pawan Harish and P. J. Narayanan, in IEEE Transactions on Visualization and Computer Graphics, (TVCG) 2007. Vol 13, No.5, Pages 864-877, Sep/Oct 2007. Conference Papers 1. "Increasing Intensity Resolution on a Single Display using Spatio-Temporal Mixing", by Pawan Harish, Parikshit Sakurikar and P. J. Narayanan, in Indian Conference on Computer Vision, Graphics and Image Processing, (ICVGIP) 2012. 2. "View Dependent Rendering to Simple Parametric Display Surfaces" (Short Paper), by Pawan Harish and P. J. Narayanan, in EUROGRAPHICS Joint Virtual Reality Conference of EuroVR-EGVE, (JVRC) 2011. Pages 27-30. 3. "A View Dependent, Polyhedral 3D Display", by Pawan Harish and P. J. Narayanan, in ACM SIGGRAPH Virtual Reality Continuum and its Applications in Industry, (VRCAI) 2009. Pages 71-75. 4. "Culling an Object Hierarchy to a Frustum Hierarchy", by Nirnimesh, Pawan Harish and P. J. Narayanan, in Indian Conference on Vision, Graphics and Image Processing, (ICVGIP) 2006. LNCS 4338, Pages 252-263. WorkShop Posters 1. "Spatio-Temporal Mixing to Increase Intensity Resolution on a Single Display", by Pawan Harish, Parikshit Sakurikar and P. J. Narayanan, in CVPR Workshop on Computational Cameras and Displays, (CVPRW CCD) 2012.
Changes Made in the Thesis based on Reviewer’s Comments Merged chapters 1 and 2 into a single chapter to improve readability of the thesis The conclusions chapter is revised by reiterating the thesis contributions along with more detailed description of the future work. A visual representation of effect of tessellation is presented in terms of images to better explain its impact. Chapter 3, Algorithm 6 is now better explained in order for it to be easily implementable Simulated displays are better explained with processes explaining on how the images are generated, mapped and observed by the user