Linear Discriminant Function
Linear Discriminant Function. Classification vs. Prediction Classification & ANOVA Classification Cutoffs, Errors, etc. Multivariate Classification & LDF Geometric example of LDF & multivariate power k-group LDF Concentrated vs. Diffuse Structure Follow-up LDF Analyses.

Linear Discriminant Function
E N D
Presentation Transcript
Linear Discriminant Function • Classification vs. Prediction • Classification & ANOVA • Classification Cutoffs, Errors, etc. • Multivariate Classification & LDF • Geometric example of LDF & multivariate power • k-group LDF Concentrated vs. Diffuse Structure • Follow-up LDF Analyses
Follow-up Analyses for Multiple-group linear discriminant function • evaluating & reporting k-group ldf
Let’s start by reviewing what “prediction” is… • Using a person’s scores on one or more variables to make a “best guess” of the that person’s score on another variable (the value of which isn’t known) • Classification is very similar … • Using a person’s scores on one or more variables to make a “best guess” of the category to which that person belongs (when the category type isn’t known). • The difference -- a language “convention” • if the “unknown variable” is quantitative -- its called prediction • if the “unknown variable” is qualitative -- its called classification
How does classification work??? • Let’s start with an “old friend” -- ANOVA • In its usual form… • There are two qualitatively different IV groups • naturally occurring or “created” by manipulation • A quantitative DV • H0: MeanG1 = Mean G2 • Rejecting H0: tells us • There is a relationship between the grouping and DV • Groups represent populations with different means on the DV • Knowing what group a person in allows us to guess their DV score -- mean of that group
Let’s review in a little more detail… Remember the formula for the ANOVA F-test variation between groups size of the mean difference F = ----------------------------------- = --------------------------------------- variation within groups variation within groups In words -- F compares the mean difference to the variability around each of those means Which of the following will produce the larger F-test ? Why ? Data #2 (@ n = 50) group 1 mean = 30 std dev = 15 group 2 mean = 50 std dev = 15 Data #1 (@ n = 50) group 1 mean = 30 std dev = 5 group 2 mean = 50 std dev = 5 Remember -- about 96% of scores are within 2 std dev of mean
Graphical depictions of these data show that the size of F relates to the amount of overlap between the groups Data #1 Larger F = more consistent grp dif 0 10 20 30 40 50 60 70 Smaller F = less consistent grp dif Data #2 0 10 20 30 40 50 60 70 80 Notice: Since all the distributions have n=50, those with more variability are not as tall -- all 4 distributions have the same area
Let’s consider that last one “in reverse”… Could knowing the person’s score help tell us what qualitative group they are in? …to “assign” them to the proper group? an Example… Research has revealed a statistical relationship between the number of times a person laughs out loud each day (quant variable) and whether they are depressed or schizophrenic (qual grouping variable). Mean laughsDepressed = 4.0Mean laughsSchizophrenic = 7.0 F(1,34) = 7.00, p < .05 A new (as yet undiagnosed) patient laughs 11 times the first day what’s your “assignment” depressed or schizophrenic? Another patient laughs 1 time -- your “assignment”? A third new patient laughs 5 times -- your “assignment”?
Why were the first two “gimmies” and the last one not? • When the groups have a mean difference, a score beyond one of the group means is more likely to belong to that group than to belong to the other group (unless stds are huge) • someone who laughs more than the mean for the schizophrenic group is more likely to be schizohrenic than to be depressed • someone who laughs less than the mean of the depressive group is more likely to be depressed than to be schizophrenic • Even when the groups have a mean difference, a score between the group means is harder to correctly assign (unless stds are miniscule) • someone with 5-6 laughs are hardest to classify, because several depressed and schizophrenic folks have this score
Here’s a graphical depiction of the clinical data... X 18 dep. patients x x x mean laughs = 4.0 x x x x x x x x x x x x x x laughs --> 0 1 2 3 4 5 6 7 8 9 0 1 2 o o o o 18 schiz. patients o o o o o mean laughs = 7.0 o o o o o o o o o • Looking at this, its easy to see why we would be ... • confidant in an assignment based on 11 laughs • no depressed patients had a score that high • confident in an assignment based on 1 laugh • no schizophrenic patients had a score that low • lacking confidence in an assignment based on 5 or 6 laughs • several depressed & schizophrenic patients had 5 or 6
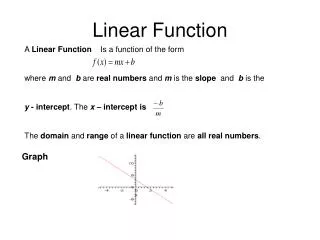
The process of prediction required two things… • that there be a linear relationship between the predictor and the criterion (reject H0: r = 0) • a formula (y’ = bx + a) to “translate” a predictor score into an estimate of a criterion variable score • Similarly, the process of classification requires two things … • a statistical relationship between the predictor (DV) & criterion (reject H0: M1 = M2) • a cutoff to “translate” a person’s score on the predictor (DV) into an assignment to one group or the other • where should be place the cutoff??? • Wherever gives us the most accurate classification !!
o o o o 18 schiz. patients o o o o o mean laughs = 7.0 o o o o o o o o o X 18 dep. patients x x x mean laughs = 4.0 x x x x x x x x x x x x x x laughs --> 0 1 2 3 4 5 6 7 8 9 0 1 2 1 1 1 • When your groups are the same size and your group score distributions are symmetrical, things are pretty easy… • place the cutoff at a position equidistant from the group means • here, the cutoff would be 5.5 -- equidistant between 4.0 and 7.0 • anyone who laughs more than 5.5 times would be “assigned” as schizophrenic • anyone who laughs fewer than 5.5 times would be “assigned” as depressed
o o o o 18 schiz. patients o o o o o mean laughs = 7.0 o o o o o o o o o x 18 dep. patients x x x mean laughs = 4.0 x x x x x x x x x x x x x x laughs --> 0 1 2 3 4 5 6 7 8 9 0 1 2 1 1 1 We can assess the accuracy of the assignments by building a “reclassification table” Actual Diagnosis AssignmentDepressed Schizophrenic Depressed 14 4 Schizophrenic 4 14 reclassification accuracy would be 28/36 = 77.78%
Getting ready for ldf… • multiple regression works better than simple regression because a y’ based on multiple predictors is a better estimate of y than a y’ based on a single predictor • similarly, classification based on multiple predictors will do better than classification based on a single predictor • but, how to incorporate multiple predictors into a classification ?? • Like with multiple regression, multiple variables (Xs) are each given a weighting and a constant is added • ldf = b1* X1 + b2* X2 + b3* X3 + a • the composite variable is called a linear discriminant function • function -- constructed from another variables • linear -- linear combination of linearly weighted vars • discriminant -- weights are chosen so that the resulting has the maximum possible F-test between the groups
So, how does this all work ??? • We start with a grouping variable and a set of quantitative (or binary) predictors (what would be DVs if doing ANOVAs) • using an algorithm much like multiple regression, the bivariate relationship of predictor to the grouping variable & the collinearities among the predictors are all taken into account and the weights for the ldf formula are derived • remember this ldf will have the largest possible F value between the groups • a cutoff value for the ldf is chosen the cutoff is chosen (more fancy computation) to maximize % correct reclassification • to “use” the formula • a person’s values on the variables are put into the formula & their ldf score is computed • their score is compared to the cutoff, and they are assigned to one group or the other
How ldf works -- two groups and 2 vars Var #2 Var #1 Plot each participant’s position in this “2-space”, keeping track of group membership. Mark each groups “centroid”
Look at the group difference on each variable, separately. Var #2 Var #1 The dash/dot lines show the mean difference on each variable -- which are small relative to within-group differences, so small Fs
The ldf variate “positioned” to maximize F Var #2 Var #1 In this way, two non-discriminating variables can combine to “work”
Like ANOVA, ldf can be applied to more than two groups. • When we have multiple groups there may be an advantage to using multiple discriminant functions to maximally discriminate between the groups. • That is, we must decide whether the multiple groups “line up” on a single dimension (called a concentrated structure), or whether they are best described by their position in a multidimensional “space” (called a diffuse structure). Maximum # dimensions for a given analysis: the smaller of# groups - 1 # predictor variables e.g., 4 groups with 6 predictor variables ? Max # ldfs = _____
“Anticipating” the number of dimensions (ldfs) By inspecting the “group profiles,” (means of each group on each of the predictor variables) you can often anticipate whether there will be more than one ldf … • if the groups have similar patterns of differences (similar profiles) for each predictor variable (for which there are differences), then you would expect a single discriminant function. • If the groups have different profiles for different predictor variables, then you would expect more than one ldf Group Var1 Var2 Var3 Var4 Group Var1 Var2 Var3 Var4 1 10 12 6 8 1 10 12 6 14 2 18 12 10 2 2 18 6 6 14 3 18 12 10 2 3 18 6 2 7 Concentrated + 0 + - Diffuse 1st + - 0 0 2nd 0 0 - -
Determining the number of dimensions (ldfs) Like other “determinations”, there is a significance test involved • Each ldf is tested as to whether it “contributes to the model” using the X²-test of the -value. • The first ldf will always account for the most between-group variation (have the largest X² and Rc) -- subsequent ldfs are “orthogonal” (providing independent information), and will account for successively less between group variation. • If there is a single ldf, then the model is said to have a concentrated structure • if there are 2 or more ldfs then the model has a diffuse structure • the distinction between a concentrated and a diffuse structure is considered the “fundamental multivariate question” in a multiple group analysis.
Follow-up analyses • Within Psychology, ldf developed in areas of research that traditionally used large samples (e.g., measurement theory & clinical diagnostic research). • With such large samples, “almost everything is significant”. • So, an emphasis on “substantial effects” developed - based on “cutoffs” and “relative size” rather than significance tests • using % variance to determine if additional ldfs “contribute” • .3-.4 cutoff for structure weights when interpreting the ldfs • using % classification to discuss “what the model does” • As ldf was “adopted” into research areas with strong traditions of significance testing, more tests were incorporated into ldf, most commonly “follow-ups”
There are three major types of follow-ups • Univariate follow-ups -- abandoning the multivariate analysis, simply describe the results of the ANOVA (with pairwise comparisons) for each of the predictors (DVs) • ldf follow-ups -- use the ldf(s) as DVs in ANOVA (with pairwise comparisons) to explicate what which ldfs discriminate between what groups • this nicely augments the spatial & re-classification depictions • if you have a concentrated structure, it tells you exactly what groups can be significantly discriminated • if you have a diffuse structure, it tells you whether the second ldf provides discriminatory power the 1st doesn’t
pairwise ldf follow-ups -- separate ldf analyses for each pair of groups to explicate which variables maximally discriminate between what groups • this is just what it sounds like • compare groups 1 & 2 then 1 & 3 then 2 & 3 • interpret the ldf and tell the discriminatory power for each • might produce pairwise discriminations not provided by the overall analysis • Different texts/researchers seem to have strong opinions about which of these is the “true multivariate follow-up” or which is “more multivariate”. I’d suggest that usually one of them is a more direct test of the way you have conceptualized your research question or analysis. Trying both probably won’t hurt!