Linear Function
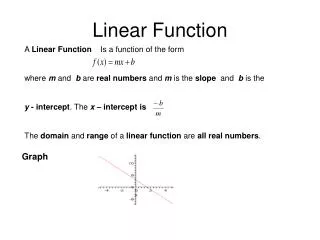
Linear Function. A Linear Function Is a function of the form where m and b are real numbers and m is the slope and b is the y - intercept . The x – intercept is The domain and range of a linear function are all real numbers. Graph. Graph of a Linear Function.

Linear Function
E N D
Presentation Transcript
Linear Function A Linear Function Is a function of the form where mand bare real numbers andm is the slope and bis the y - intercept. The x – intercept is The domain and range of a linear function are all real numbers. Graph
Graph of a Linear Function The linear function can be graphed using the slope and the y-ntercept Example If m = 3 b = 2 The linear function can be graphed using the x and the y-intercepts
Average Rate of Change The average rate of change of a Linear Function is the constant For example, For f(x)= 5x - 2 , the average rate of change is m =5
Page 121 #15 • f(x) = -3x+4 • The slope is m = -3, the y-intercept b = 4 • The average rate of change is the constant m = -3 • Since m =-3 is negative the graph is slanted downwards. Thus the function is decreasing
Page 121 #19 • f(x) = 3 • f(x)=0x + 3 • m = 0 b = 3 • The average of change is 0 • Since the average rate of change, m = 0 • The function is constant neither increasing or decreasing
Page 121 #21 • To find the zero of f(x), we set f(x) = 0 and solve. • 2x - 8 = 0 • x = 8/2 = 4 • y-intercept • Will graph in class
Page 121 #25 • To find the zero of f(x), we set f(x) = 0 and solve. • x - 8 = 0 • x = 16 • y-intercept • Will graph in class
Linear or Non Linear Function • If a function is linear the slope or rate of change is constant • That is is always the same
Page 121 #28 The rate of change is not constant. Not a Linear Function
Page 121 #32 • Note the rate of change is constant. It is always • m =.5 thus the function is linear
Page 121 #38 If g(x) =-2x+30=0 -2x+30=0 -2x = -30, x = 15 y = g(x) 60=-2(-15)+b b = 30 y =g(x) =-2x +30 If g(x) =-2x+30=20 X = 5 (-15,60) If g(x) -2x+30=60 -2x+30 60 -2x 30, x 15 (5,20) (15,0) If g(x) =-2x+30=60 -2x+30=60 -2x = 30, x = -15 0<2x+30<60 -30 < -2x < 30 15 > x > -15
Page 122 # 44 • Cost Function: C(x) = 0.38x + 5 in dollars • Find Cost for x = 50 minutes • C(50) = .38(50) + 5 = 19+5= $24 • Given Bill, find cost • C(x) = 0.38x + 5 = 29.32 • 0.38x = 24.32 x = 24.32 /.38 x = 62 • Estimated Cost of Monthly Bill, find Maximum minutes • 0.38x + 5 = 60 0.38x = 55 x = 55 /.38 x = 144.8 • Can use as many as 144 minutes
Page 122 # 48Supply(S) and Demand(D) • Equilibrium: Supply = Demand • S(p) = -2000 + 3000p = D(p) =10,000 -1000p • -2000 + 3000p =10,000-1000p • 4000p =12000 p = 3000 • Quantity sold if Demand is less than Supply • If 10,000 -1000p < -2000 +3000p 4000p > 12000 p > 3000 • The price will decrease if the quantity of demand is less than the quantity of supply
Page 122 # 54Straight Line Depreciation • Straight Line Depreciation = Book Value / approximate life • Let V(x) be value of machine after x years • Cost of machine = Book Value = V(0) • V(x) = 120,000 – ($120,000 / 10)x = -12,000x +120,000
Page 122 # 54Straight Line Depreciation(cont) • Book value after 4years = –12000(4)+1210,000 =120000-8000=72000 • After 4 years the machine will be worth $72,000