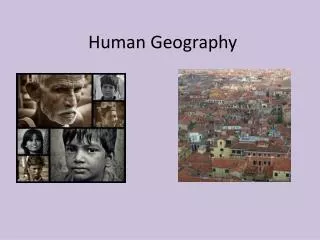
Human Geography
Human Geography. 7 Billion People on Earth…what if it was a Village of 100? 61 Asians, 13 Africans, 12 Europeans 5 South America/Caribbean, 8 North America, 1 Oceania 50 female, 50 male 12 would have a disability

Human Geography
E N D
Presentation Transcript
7 Billion People on Earth…what if it was a Village of 100? 61 Asians, 13 Africans, 12 Europeans 5 South America/Caribbean, 8 North America, 1 Oceania 50 female, 50 male 12 would have a disability 33 Christian, 21 Muslim, 13 Hindu, 6 Buddhist, 1 Sikhs, 1 Jewish, 11 other religion, 11 non-religious, 3 Atheist 43 live without basic sanitation 20 people hold the top 75% of the world’s wealth 12 illiterate, 5 college education, 12 own computers 14 are malnourished 26 would be under age 14, 66 between 15 – 64, 8 would be over age 65 World as a Village of 100
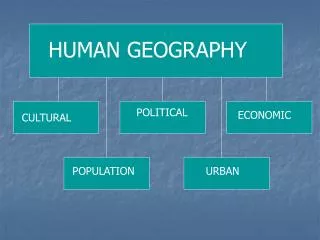
Human Geography • A major component of the 5 Themes of Geography is humans • Humans have the greatest impact on the world • This unit will take a brief look at humans as a single entity before we dive in to the regions of the world • We will look at humans in the following ways • Population Geography • Economic Geography • Political Geography • Cultural Geography
Human Population • The estimated population of the world was 6,879,360,480as of 11/4/10 at 5:01am • The estimated population of the USA was 310,631,305as of 11/4/10 at 5:01am • Every year we add approx. 80 million people to the planet • Population Clock • What is it right now? • USA = • World =
The Study of Human Population • Human populations have changed over time and location • Some time periods of history witnessed a decline in population (the Black Death), while other times witnessed an increase in population (Baby Boom) • The study of human population is called demography
Population Distribution • The distribution of humans on Earth is unequal • Ninety percent of humans live in the Northern Hemisphere • One of Two humans live in East or South Asia • Two-Thirds of humans live between 20°N and 60°N • Most humans are concentrated in 4 regions • East Asia • South Asia • South East Asia • Western Europe
Population Distribution • Why is the distribution of the world population unequal? • Habitable (livable) land (fertile soil) • Climate (tundra vs. humid subtropical) • Access to water and land forms (mountains) • Availability of natural resources • Economic development (rich vs. poor country) • Government policy (stable vs. war-torn) • Rural (country-side) vs. Urban (city) • Conflicts
Where Do Humans Live? • Similarities across regions • Live near water (river, ocean, lake, bay) • 2/3 of world’s population lives 300 miles from an ocean • Low lying areas • Fertile soil • Temperate climate • Northern Hemisphere between 10° and 55°
Where Don’t Humans Live • 3/4th of world’s population lives on less than 5% of the land • Where don’t humans live? • Dry lands • Wet lands • Cold lands • High lands
Largest Cities, Worldwide Millions 1950 2000 2015 Source: United Nations, World Urbanization Prospects: The 2003 Revision (medium scenario), 2004.
Population Density • As a result of the unequal distribution of humans on Earth, certain areas are more dense with humans than others • Demographers use population density to study regions of the Earth • Population Density = people/sq. mi. • Canada = 8 people/sq. mi. • Bangladesh = 2,361 people/sq. mi • USA = 70 people/sq. mi. • New Jersey = 1,098 people/sq. mi. • Alaska = 1 people/sq. mi.
Population and Space • Density Above: Hong Kong Left: Mongolia
Population Growth • Since the early 1800’s, the world has seen a drastic increase in population • It wasn’t until after 1800 that world pop. Reached 1 Billion • In the past 50 yrs., world pop. Doubled • In the next 50yrs., Asia and Africa is expected to increase, while Europe is expected to decrease
0 CE - < 300 million 1650 - 500 million 1850 - 1 billion 1930 - 2 billion 1960 - 3 billion 1976 - 4 billion 1987 - 5 billion 1999 - 6 billion Today: ~7 Billion Why? Epidemics, undependable food supplies, poor sanitation, inadequate medical treatment, warfare Improvements in the above (food supplies and medical care) led to dramatic population increases Impacting events: Neolithic Revolution European Exploration Industrial Revolution Urbanization Estimation for 2021: 8 Billion!!! World Population Growth
Why Does Population Grow? • Reasons for population growth • Modern medicine and hygiene • Education • Industrialization and Urbanization • Economic development • Government Policy • Role of women in society • Migration
12 11 2100 10 9 Modern Age Old 8 Iron Middle Bronze Stone Age New Stone Age Ages Age Age 7 Future 6 2000 5 4 1975 3 1950 2 1900 1 1800 Black Death — The Plague 2000 1+ million 7000 6000 5000 3000 1000 A.D. 4000 A.D. A.D. A.D. A.D. A.D. years B.C. B.C. B.C. B.C. B.C. B.C. B.C. 1 1000 2000 3000 4000 5000 World Population Growth Through History Billions Source: Population Reference Bureau; and United Nations, World Population Projections to 2100 (1998).
Tracking Population Growth • Crude Birth Rate (CBR) – Number of live births/1,000 people • Crude Death Rate (CDR) – Number of deaths/1,000 people • Natural Increase Rate (NIR) – CBR-CDR=NIR • Infant Mortality Rate (IMR) – Number of infant (under 1 year) deaths/1,000 people • Fertility Rate – Average number of children women have • Life Expectancy – Average number of years one can expect to live • Migration – the movement of people in and out of a political unit
Demographic Transition Model The “boom”
Displaying Population Growth • How do demographers display the growth of population? • Population Pyramid (Age-sex Pyramid) • Ages broken down in to five year groups • Youngest at the base • Length of bar is % of pop. in that age group for that gender • Bar Graph • Line Graph
Population Structures by Age and Sex, 2005 Millions Less Developed Regions More Developed Regions Age 80+ 75-79 70-74 65-69 60-64 55-59 50-54 45-49 40-44 35-39 30-34 25-29 20-24 15-19 10-14 5-9 0-4 Male Female Male Female Age Distribution of the World’s Population Source: United Nations, World Population Prospects: The 2004 Revision, 2005.
Websites • Measures of America • http://www.measureofamerica.org/ • Mapping the World • http://show.mappingworlds.com/usa/?lang=EN
4 3 5 2 1
Analysis of Italy’s Population Pyramid • 1. Decline in Birth Rate • 2. Baby Boom • 3. Fewer men due to World War I and II • 4. More women due to: a. longer life expectancy and b. World Wars (I and II) • 5. More 75-79 yrs. than 0-4 yrs. Signs of a future worker shortage and an overall declining population.
Population Pyramids at Different Scales Country State County (Borough)
http://dsc.discovery.com/fansites/deadliestcatch/deadliestcatch.htmlhttp://dsc.discovery.com/fansites/deadliestcatch/deadliestcatch.html
Helpful Hints… A. Ann Arbor, MI - University of Michigan B. Buffalo County, SD - Crow Creek Indian Reservation, one of the poorest counties in the United States C. Fort Bragg, NC - United States Army Fort D. Leavenworth, KS - United States Penitentiary E. Manhattan, NYC - wealthy downtown, few large families F. Northampton, MA - Smith College, an all girls college G. Punta Gorda, FL - retirement community H. Springfield, IL - average American city