Download
1 / 38
380 likes | 528 Views
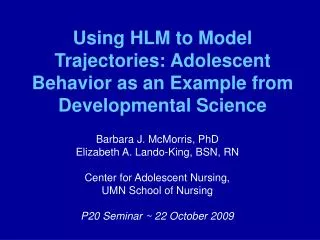
Using HLM to Model Trajectories: Adolescent Behavior as an Example from Developmental Science. Barbara J. McMorris, PhD Elizabeth A. Lando-King, BSN, RN Center for Adolescent Nursing, UMN School of Nursing P20 Seminar ~ 22 October 2009. Objective of this P20 Seminar:.

E N D
Using HLM to Model Trajectories: Adolescent Behavior as an Example from Developmental Science Barbara J. McMorris, PhD Elizabeth A. Lando-King, BSN, RN Center for Adolescent Nursing, UMN School of Nursing P20 Seminar ~ 22 October 2009
Objective of this P20 Seminar: • The learner will be able to describe unique features of using an HLM approach to modeling change over time, and advantages and limitations associated with this technique. Barbara J. McMorris, PhD Senior Associate, Center for Adolescent Nursing
Outline • Logic of hierarchical models • Logic of growth models • Using HLM terminology, multilevel equations • Data considerations, equations, model building • Applied data example • Stress Management Skills in Adolescent Girls • Pros and Cons of HLM growth model • Relevance to Nursing
Logic of hierarchical models • Multilevel models – what does that mean? • Hierarchical Linear Modeling (HLM) --- general set of modeling techniques --- addresses correlated observations • “HLM” software
HLM Example: Persons within Groups • Lucas et al. (2007) • Examined relationship between nursing home residents’ satisfaction and nursing home characteristics • Clustering effect within nursing homes • Problem: Single-level statistical models will not account for clustering • Solution: Use HLM
HLM Example: Persons within Groups (cont.) • Factors that could affect satisfaction: • Resident level: Age, Gender*, Race, Education, Payer source, Total ADL dependency*, cognitive function*, self-reported health*, Psychosocial distress, Daily pain*, Participation in decision making*, Length of stay • Organizational level: • System Structure Resources: State*, Urban/rural*, Facility size, For profit/not for profit, Multi-facility Chain/non-chain*, Acuity index • Financial Resources: %Medicaid, Occupancy rate • Clinical Resources: Special Care Unit (SCU)*, Total nurse staffing, RN staffing, LPN staffing, CNA staffing*, Licensed Nurse (RN & LPN) Staffing • Administrative Resources: Leadership turnover, LNHA Experience, Family council provided* *Significant in Combined HLM model
Assessing change over time: Measures within persons • First, what do we mean by time? • Examples: • Seconds, hours, days, weeks, months, years • Age • Grade • Data collection wave • Baseline, 6 mo, 12 mo, 18 mo
Consider: what is the role of time in your research question? Time as a predictor -measure outcome at multiple occasions per person • Want to describe: • how outcome behaves over time for each person • 2. whether other variables predict differences in change over time
Time as a Predictor of Outcomes • Other potential predictors: gender, race/ethnicity, education, SES prior health status, treatment condition, marital status, parenting style, etc. • Predictors may be: time-invariant or time-varying
An example of linear trajectories Mehta and West (2000)
Logic of growth curve models • Purpose is to model change over time • Linear or nonlinear models possible • Model variability in change (slopes) by modeling individual growth curves • Variability in initial status or average change • Predictors can be used to account for variability
Examples of Growth Curves High variability in Intercepts and Slopes antisocial behavior Low variability in Intercepts and Slopes condom use time time
Examples of Growth Curves (cont.) Low variability in Intercepts and High variability in Slopes use of birth control time
Some data considerations: • It matters how you set up the data • Contrast datasets • “Person-Level” approach • “Person-Period” approach • Software programs need data to be organized in “person-period” format
Typical Data Structure: Person-Level One line of data per person; multivariate format; horizontal data set; wide format
Person-Period Data Multiple lines of data per person; stacked; vertical format; long format
HLM approach to growth curves (Bryk & Raudenbush, 1992) Level 1 describes individual change trajectories for all people in sample. How does each person change over time? Level 2 uses additional predictor variables to help describe change trajectories. What predicts inter-individual differences in change? Levels estimated simultaneously.
Level 1 (“within person”): Individual change trajectories Each person has… Some error in predicting the change trajectory per occasion A score at a given occasion An initial status point A rate of change “the change parameters” Panter, 2004
Level 2 (“between person”): Predicting Level 1 trajectories Regression weights From Level 1 initial status rate of change Average level in the sample Errors associated with these prediction models Note: subscripts starting with 0 are about initial status; subscripts starting with 1 are about growth rate. Panter, 2004
Building an HLM growth curve model • Build your person-period dataset • Look at empirical growth plots • Fit models in a stepwise fashion: • Unconditional means model • partitions variance into between and within person • Unconditional growth model • Is there significant change over time? • Conditional models • Predict initial status • Predict growth over time
Some design considerations • Centering time helps... choose a meaningful “beginning of time.” • At least three waves needed; more is better for precision • Equal or unequal spacing of data collection waves • Not every person needs same number data points “Missing” data are ok at level 1 • Possible to have more than 2 levels
Example: Adolescent Stress Management Skills over Time • Research Question: Do stress management skills change over time in girls who participate in high risk sexual activities? • Study: Prime Time (PI: Sieving) • Clinic-based youth development intervention study • Aims to reduce multiple risk behaviors • Sample • Urban teen girls (ages 13-17) at high risk for early pregnancy • Attending either community or school-based clinic
Outcome Measure: Stress Management Scale • When I get angry, I act without thinking. • I get upset easily. • When I am mad at someone, I stay mad for a long time. • I get angry easily. • I have a temper. • I fight with people • I get too upset about things. • I can stay calm when I am upset. From Bar-On Emotional Quotient Inventory (Youth Version) From Bar-On Emotioal Quotient Inventory (Youth Version)
Plots of trajectories for “average” girl and 1 high and 1 low girl
Unconditional Growth Model Equations • Level 1: Within-person model Y(StressMan) = 0i(initial StressMan score) + 1i(Time slope) + it • Level 2: Between-person model • 0i(initial StressMan score) = γ00 (group mean) + ζ0i • 1i(Time slope) = γ10 + ζ1i
Unconditional growth model *p < .01
Predictors of Intercept and Slope (1) Model Building • Model 1: Adding treatment vs. control as predictor of change Level 1: …same as before Level 2: 0i(initial StressMan score) = γ00 (group mean) + ζ0i 1i(Time slope) = γ10 + γ11 (Treatment) + ζ1i
Predictors of Intercept and Slope(2) Model Building • Model 2: Age predicts both intercept and slope? • Model 3: Clinic site predicts both intercept and slope? • Model 4: Use signif predictors from Models 1-3
Predictors of Intercept and Slope (3) Results • Model 1: Girls in treatment have significantly steeper rate of growth (p = 0.03) • Model 2: Age not a significant predictor • Model 3: Clinic site not a significant predictor
Estimation of parameters • Maximum likelihood (ML): Seeks those parameter estimates that maximize the likelihood function, which assess the joint probability of simultaneously observing all the sample data actually obtained • Full ML: Simultaneously estimates the fixed effects and the variance components.
More complicated models • More time points = more ways to model time • change can be curvilinear, sine function, etc. • See Henly’s 2008 seminar on change functions • Time-varying variables at Level 1 • what else besides time would be expected to vary? • Piecewise growth models
Pros - Advantages • Data are modeled at individual level • Treatment of time variable is flexible • Model can incorporate three levels of nesting/clustering • Non-normal data can be modeled: ordered categories, dichotomous, and Poisson-distributed outcomes
Cons - Limitations • Only one dependent variable at a time • Cannot examine: • indirect effects (a.k.a. SEM models) • spurious relationships • HLM software has its quirks • Setting up datasets from other software packages • No missing data at level 2
Why are trajectory models important to nursing research? • Ability to look at people within the natural context of time • As nurses we are interested in how people function, or change, over time • Increases real world applicability of research • Individual focus of trajectory models
References • Bar-On, R. (2006). The Bar-On model of emotional-social intelligence (ESI). Psicothema, 18, supl., 13-25 • Bryk, A.S. & Raudenbush, S.W. 1992. Hierarchical Linear Models: Applications and data analysis methods. Advanced quantitative techniques in the Social Sciences 1. Thousand Oaks, CA: Sage Publications. • Lucas, J.A., Levin, C.A., Towe, T.J, Robertson, B, Akincigil, A., Sambamoorthi, U, Bilder, S, Paek, E.K., & Crystal, S. 2007. “The relationship between organizational factors and resident satisfaction with nursing home care and life.” Journal of Aging and Social Policy 19(2): 125-151. • Mehta, P.D. & West, S.G. 2000. “Putting the individual back into individual growth curves.” Psychological Methods 5: 23-43. • Panter, A.I. 2004 . “Analytic approaches for assessing individual and group differences in developmental change.” Methodology workshop presented to the Family Research Consortium IV, Summer Institute: Life Span Transitions, Families, and Mental Health, San Juan, Puerto Rico. Friday, July 16, 2004. • Singer, J.D. & Willett, J.B. 2003. Applied Longitudinal Data Analysis: Modeling Change and Event Occurrence. New York: Oxford University Press, March, 2003. http://gseacademic.harvard.edu/alda/
THANK YOU! • This presentation was supported in part by the Adolescent Health Protection Research Program (School of Nursing, University of Minnesota) grant number T01-DP000112 (PI: Bearinger) from the Centers for Disease Control and Prevention (CDC). Its contents are solely the responsibility of the authors and do not necessarily represent the official views of the CDC.