Solar Demon Real-Time Data Monitoring & Analysis Tool
Solar Demon automatically detects & characterizes solar flares, dimmings, and EUV waves for space weather applications. Visit www.solardemon.oma.be for results and details. Analyzing SDO/AIA 9.4nm and 21.1nm synoptic images. Flare, dimming, EUV wave detection with precise data analysis for better understanding. Reliable tool for automated detection of solar activities. Contact emil.kraaikamp@observatoire.be for questions or suggestions.

Solar Demon Real-Time Data Monitoring & Analysis Tool
E N D
Presentation Transcript
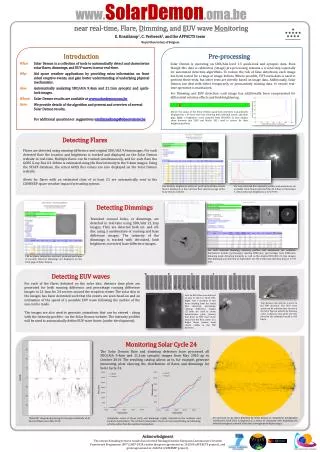
www.SolarDemon.oma.benear real-time, Flare, Dimming, and EUV wave Monitoring E. Kraaikamp1, C. Verbeeck1, and the AFFECTS team 1Royal Observatory of Belgium • Pre-processing • Solar Demon is operating on SDO/AIA level 1.5 quick-look and synoptic data. Even though this data is calibrated, (image) pre-processing remains a crucial step especially for automated detection algorithms. To reduce the risk of false detections, each image has been tested for a range of image defects. Where possible, FITS meta-data is used to perform these tests, but other tests are directly based on image data. Additionally, Solar Demon can deal with either temporarily or permanently missing data, to ensure real-time operation is maintained. • For Dimming and EUV detection, each image has additionally been compensated for differential rotation effects and limb brightening. Introduction What Why How Where Here Solar Demon is a collection of tools to automatically detect and characterize solar flares, dimmings, and EUV waves in near real-time. Aid space weather applications by providing extra information on front sided eruptive events, and gain better understanding of underlying physical mechanisms. Automatically analyzing SDO/AIA 9.4nm and 21.1nm synoptic and quick-look images. Solar Demon results are available at www.solardemon.oma.be We provide details of the algorithm and present and overview of several Solar Demon results.. For additional questions or suggestions: emil.kraaikamp@observatoire.be Above: the status of the Solar Demon quick-look detectors is graphically displayed by a 24 hour time line showing both detected events and data gaps. Right: a brightness curve sampled from SDO/AIA 21.1nm images taken between July 2010 and March 2011 used to correct for limb brightening effects. Detecting Flares Flares are detected using running difference and original SDO/AIA 9,4nm images. For each detected flare the location and brightness is tracked and displayed on the Solar Demon website in real-time. Multiple flares can be tracked simultaneously, and for each flare the GOES X-ray flux 0.1-0.8nm is estimated using the flare intensity in the 9.4nm images.Using the STAFF database, the actual GOES flux values are also displayed on the Solar Demon website. Alerts for flares with an estimated class of at least C5 are automatically sent to the COMESEP space weather impact forecasting system. The location, brightness, and start, peak and end time of each flare is displayed on the real-time flare detection page of the Solar Demonwebsite. For each detected flare intensity profiles and animations are available. Solar Demon detected this X1.6 flare on November 7, 2014 with peak brightness at 17:27 UTC. Detecting Dimmings Transient coronal holes, or dimmings, are detected in real-time using SDO/AIA 21.1nm images. They are detected both on- and off-disc using a combination of running and base difference images. The intensity of the dimmings is tracked with derotated, limb brightness corrected, base difference images. For each detected dimming, intensity profiles and animations are available. Animations include (percentage) running difference, (percentage) base difference, dimming mask, dimming intensity, as well as the original SDO/AIA 21.1nm images. This dimming was detected on September 10, 2014 with peak intensity drop at 17:39 UTC. The locations, intensities, and start, peak and end times of recently detected dimmings are displayed on the front page of Solar Demon. Detecting EUV waves W N E S W For each of the flares detected on the solar disc, distance time plots are generated for both running difference and percentage running difference images in 21.1nm for 24 sectors around the eruption center. The solar disc in the images has been derotated such that the events are seen head-on and an estimation of the speed of a possible EUV wave following the surface of the sun can be made. The images are also used to generate animations that can be viewed - along with the intensity profiles - on the Solar Demon website. The intensity profiles will be used to automatically define EUV wave fronts (under development). Left: An M6.5 flare was detected on July 8, 2014 at 16:26 UTC. Right: over a duration of two hours starting from the initial flare detection, percentage running difference images (21.1nm) are used to create distance-time plots (above) that show an EUV wave move away from the flare center as a bright linear feature most clearly visible in the NW direction. Top: distance time plot for a sector in the NW direction. The EUV wave speed can be estimated per sector on the Solar Demon website by drawing a line in distance time plots. For this direction the estimated speed is 540 km/s. Monitoring Solar Cycle 24 The Solar Demon flare and dimming detectors have processed all SDO/AIA 9.4nm and 21.1nm synoptic images from May 2010 up to October 2014. The resulting catalog allows us to, for example, generate interesting plots showing the distribution of flares and dimmings for Solar Cycle 24. Latitude Flare count Dimming count Time (years) Time (years) An overview of all flares detected by Solar Demon in Stonyhurst heliographic coordinates. Each flare is depicted as a series of connected dots displaying the intensity-weighted centroid of the flare throughout multiple images. “Butterfly” diagram displaying the Stonyhurst latitude of all detected flares since May 2010. Cumulative count of flares (left) and dimmings (right) detected in the northern and southern hemisphere. The northern hemisphere shows an increased flaring and dimming activity earlier than the southern hemisphere. Acknowledgment The research leading to these results has received funding from the European Commission's Seventh Framework Programme (FP7/2007-2014) under the grant agreement nr. 263506 (AFFECTS project), and grant agreement nr. 263252 (COMESEP project). Solar-Terrestrial Centre of Excellence