Download
1 / 46
460 likes | 809 Views
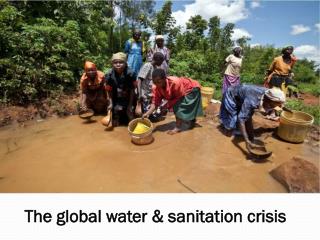
Global Water Crisis: How it could Affect US Cities. Peter Rogers Harvard University Keynote Speech Mayors Water Council—Mayors Water Summit Breakers Hotel, Palm Beach November 20, 2008. Outline of Speech. Magnitude of problem: Society, Economics and Hydrology Global and US

E N D
Global Water Crisis: How it could Affect US Cities Peter Rogers Harvard University Keynote Speech Mayors Water Council—Mayors Water Summit Breakers Hotel, Palm Beach November 20, 2008
Outline of Speech • Magnitude of problem: Society, Economics and Hydrology • Global and US • Climate Change: Why focus on water? • Demographics or Climate change? • Some forecasts: sea level, precipitation • Floods, droughts, and tropical storms • Remediation and mitigation • A modest proposal for US cities • The infrastructure problem • The quest for ever improved water quality • Closing the loop on water-wastewater treatment • Conclusions
Cities and Industries use very little of total globally available water Source. Comprehensive Assessment, 2007
Short Term Forecasting • The scientific community is notoriously bad at short-term forecasting, never mind long-term forecasting • We are better at some things like human populations since for the short-term almost all of the persons likely to procreate in the next 30 years are already born! • We are not good at forecasting items derived from population, but influenced by socio-economic parameters such as affluence • For example, in 1937 President Roosevelt convened a panel of scientists and engineers to assess likely technological advances in the next 5-10 years. The panel missed all of the major developments, including radar, jet airplanes, and nuclear explosions
US WATER WITHDRAWAL FORECAST 1950–2000 Source. Rogers, 1993, with actual 1995 and 2000 added
What is it now (2008)? • As far as I can determine the USGS has not yet cleared for release even the 2005 estimate • A sad comment on the availability of reliable data at the national level • We are left with the 2000 estimate as the basis of predicting future demands
WHAT ARE THE DIMENSIONS OF THE WSS PROBLEM IN THE US? • Most utilities for both water and wastewater have problems covering the cost of services • Many have deferred maintenance due to capital shortages • GAO (2002) estimated that investments between $300 billion and $1 trillion would be needed over the next 20 years (not include ag. & ind.) • These costs apparently did not include the costs of the evolving storm water regulations estimated, for example, to cost over $23 billion just for the Los Angeles Water Board Region over the next 20 years • During the past decade, about $7 billion per year has been provided by federal and state resources • US Council of Mayors (2008) reports that cities and local governments spent $64 billion per year from 1992-2005, $82 billion in 2007, and are facing $110 billion per year by 2010
Causes of Global Water Crisis • Causes of Present Crisis • Increasing and urbanizing populations • Increasing wealth • Change in weather patterns • Increasing demand for ever cleaner water • Causes of Pending Crises • Continued growth of population and wealth • Climate induced changes in rainfall, sea level rise, and frequency of storms and droughts • Protection of non-human ecosystems
Climate Change has major role in exacerbating the Pending Global Water Crisis, but it is not the only thing • Uncertainty of supply • Intrinsic variability of hydrology with the additional unknown variability associated with climate change • Continued rapid economic and population growth • Increased demands for irrigation water • Increased demands for urban water • Restoration of Environmental Flows • Forced by collapse of aquatic communities, maybe exacerbated by climate change • Transboundary water conflicts • Potential for good or evil, potentially affected by climate change • Idiosyncrasy of water institutions • Effective water management is prevented by poor governance, this needs to be addressed apart from climate change
Water Management and Uncertainty • The history of water management is one of continuous adaptation to uncertainties; water engineering is about learning from mistakes. • Various rules, procedures, design safety factors have evolved to accommodate rural and urban users. • There is a significant turnover in water management infrastructure: ~ every 30 yrs capacity can be upgraded/ reconfigured to adapt – rehabilitation. • The discount rate, BCA procedures, maximizing NED benefits are more relevant than climate uncertainty in determining modes of adaptation. Source. Stakhiv, 2007.
What’s Different This Time? • Since the Medieval warming period (900–1300) we have added 6 billion people. • The majority of the earth’s population now is far wealthier than in previous times. • By 2050 there will be 9 billion humans seeking resources on the globe. • Even without global warming, we would need major adaptation strategies to cope with this huge population increase. • In the past warm periods the human population was mobile and could move into more congenial regions; now we have national boundaries. • By 2007 the majority of the world’s population were urbanized and with less flexibility to move. • The next 3 billion will be urban dwellers.
Climate Change How useful are the predictions to guide water policy?
Why Focus On Water? The IPCC (Working Group II, Summary for Policymakers, 2007) identifies 5 key impacts of increasing global average temperature. These are on: water, ecosystems, food, coasts, and health. A closer reading of the texts shows that many of the most serious impacts on the non-water areas are in fact mediated via water. So, for instance, impacts on food are largely due to hydrological changes, aridity has major impacts on the ecosystems, and health vectors. The pivotal role of water impacts are largely felt in the socio-economic sphere, hence its importance to adaptation rather than mitigation
Climate Change Only Population Change Only Population and Climate Change Red indicates regions where the future water demand is more than 120% of the 2000 demand Published by AAAS C. J. Vorosmarty et al., Science 289, 284 -288 (2000) 2025 simulations using 30’ interpolations from CGCM1 and HadCM2
Sea Level Rise What is realistic to expect over the next 100 years?
Add or subtract from the 2080 to 2099 ensemble mean (based on 16 AOGCMs) of 0.3 m
James G. Titus and Charlie Richman, Maps of Lands Vulnerable to Sea Level Rise, EPA, 2001.
IPCC Precipitation Forecasts 18 GCM models give radically different precipitation estimates for regional rainfall. Impossible to choose which to use On the following slides red implies lower than the year 2000 rainfall and blue implies higher rainfall For these model results the rain in Florida could increase, or decrease, by as much as 6 mm per month in August by 2099 above or below the 5 to 8.5 mm today How useful are these forecasts?
NCAR Jan.2030 A2 and B1 Japan & UK B1
Floods, Droughts, and Tropical Storms Increased populations at risk, rising wealth, and increased property values confound time series analysis. One thing is clear; for a storm of the same magnitude the damages increase over time because of these effects
Fig. 2. (A) Smoothed DAI reconstruction (solid black curve) for the West, showing two-tailed 95% bootstrap confidence intervals (dashed black curves) and the long-term mean (thin horizontal black line) long-term mean E. R. Cook et al., Science 306, 1015–1018 (2004) Published by AAAS DIA is the number of exceedences of a specific PDSI threshold
Source. Stakhiv, 2007 Katrina (2005) caused $100 billion which was less than 1% GDP
Mechanisms for Adapting to Uncertainties • Planning new investments, or for capacity expansion (reservoirs, irrigation systems, levees). • Operation & regulation of existing systems: accommodating new uses or conditions (e.g. ecology, climate change, population). • Maintenance and majorrehabilitation of existing systems (e.g. dam safety, levees, etc.). • Modifications in processes and demands (water conservation, pricing, regulation, legal). • Introduce new efficient technologies(desalting, biotechnology, drip irrigation, reuse, recycling, solar, etc.). Source. Stakhiv, 2007
Water Problems in US Cities Not this…
What’s wrong with this picture? This is “adequate WSS” according to the WHO!
Deferred Maintenance? 43% of cities report repair and replacement cycles exceed 50 years for water pipes, and for sewer pipes 65% have repair and replacement cycles exceeding 200 years
High tide, Miami, 9/27/08, 9:15 am Katrina, 2005
How serious is the problem of water and wastewater infrastructure? • Drinking water and wastewater declined from a D to a D- in the past four years • 43% of cities report repair and replacement cycles exceed 50 years for water pipes • Over a million miles of water pipes in the U.S. – generally aren’t replaced until failure • Some lead – even wood – service lines and water mains are still in service today
Current Financial Disaster is Crying out for Government Investment in Infrastructure • Water and Sewer looks like a good place to invest • The Cadmus Group (August 2008) estimated that $1 invested in water and sewer infrastructure increases Gross Domestic Product in the long run by $6.35 (9.7% rate of return). • One job in water and sewer infrastructure creates 3.68 jobs in the national economy to support that job. • They claim that these are larger than for highways.
US Should Close the Loop between Wastewater and Potable Water • Increasing demands • Population • Affluence • Droughts • Ever increasing regulation • Current EPA 90 contaminants looking towards 129 • Concern about pharmaceuticals in drinking water • Costs of adding and replacing new treatment plants • New water and wastewater plants increasingly expensive and subject to regulatory creep • Reuse using advanced ultra filtration and RO could solve these problems • Maintaining a high level of quality at a single plant would reduce the total cost of two plants neither at high contaminant removal levels • Would also reduce the demand for “new” water by as much as 40-50% • The water saved would be “drought-proof” supply.
They said “it would never be acceptable to consumers” • The new trend in water-scarce areas in the US and abroad is to introduce reused (recycled) water into the potable supply • Orange County’s Groundwater Replenishment System (GWR) • $480 million, 70 mgd to seawater barrier, future 60 mgd directly to GW • GWR generates enough water to meet the needs of 500,000 people and meets all state and federal drinking water standards • Singapore’s NEWater • 50 mgd in 2007, planned 500 mgd on line by 2011 • Windhoek, Namibia, probably the first directly to drinking water • My contention is that given the costs of separate treatment and the demands for higher levels of contaminant removal, it will be appropriate for large parts of the water –rich regions in the US to move in this direction.
The $22.6 trillion global need for all types of water infrastructure from 2005 until 2030 seems like a daunting number, but really how large is it compared with the global GDP and expenditures in other social sectors? It turns out to be about 1.5% of annual global GDP, or about $120 per capita. Global spending on health amounted to 4.3% of GDP in 2005. For Africa, with an income of per capita $490, all water infrastructure would cost $37 per capita per year, and for Asia with an income of $800 per capita the water infrastructure costs would amount to $138 per capita per year. These amounts while sounding small to our industrialized country ears are still very high as a percentage of income, but achievable amounts for the poor countries and could be reduced with more agricultural research and sanitation outreach programs.
Six Adaptations necessary to meet increasing population and affluence with, or without, climate change • Increase infrastructure investments • Huge need for investments in new and improved water supply and wastewater facilities. Even in the developed world deferred maintenance has left the infrastructure in a dangerous situation. • Asymmetries in water uses • Irrigation flywheel; 80-85% water used for irrigation, a 10% improvement in efficiency would double the amounts available for D and I water needs • Virtual water escape hatch • Already resolving many water scarce situations; export of agricultural products from water-rich countries allows water-scarce to economize on domestic water use • Low cost desalination breakthrough • Coastal cities have almost unlimited supply of potable water; new RO and ultra filtration technologies have reduced the cost to that of traditional sources (US50 cents per cubic meter) • Eco-sanitation revolution • Decoupling of water and sanitation; dry sanitation is becoming economically feasible even in high density settings • Water is universally underpriced • Large potential for demand side management; except for a few European countries there are huge subsidies to municipally supplied water—leads to deferred maintenance
Conclusions • Global crisis; we can have one if we are not careful • US crisis: unlikely, we have many options and a plentiful water supply, but it will be expensive • There are many mitigation options available globally and domestically • We should move to a closed system for urban water management; it will be easier to manage, maintain quality, and be drought resistant.
A Bayesian Approach to Dealing with Global Warming Despite the variable quality of the regional evidence, it is prudent to note that temperatures have risen over the past century and that we can expect to experience many of the broad impacts suggested by the IPCC over the next 50 years. We will live in a world of increasing hydrological uncertainty
The Romans Ignored The AD 202 GAO Report! Source: InfoRoma, 2004. www.inforoma.it DEFERRED MAINTENANCE?