Download
1 / 18
180 likes | 387 Views
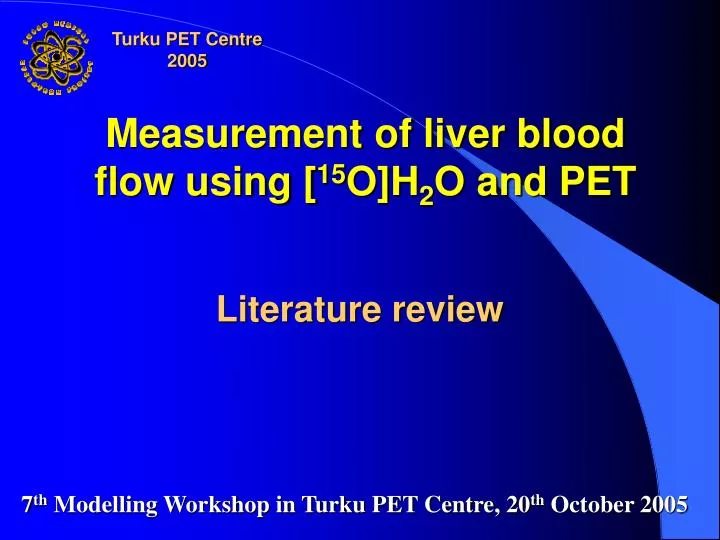
Turku PET Centre 2005. Measurement of liver blood flow using [ 15 O]H 2 O and PET. Literature review. 7 th Modelling Workshop in Turku PET Centre, 20 th October 2005. Why measuring hepatic blood flow ?.

E N D
Turku PET Centre 2005 Measurement of liver blood flow using [15O]H2O and PET Literature review 7th Modelling Workshop in Turku PET Centre, 20th October 2005
Why measuring hepatic blood flow ? • Hepatocellular carcinoma is the most frequent malignant tumor of the liver. Liver metastase play a role in the morbidity and mortality associated with this cancer Metastatic tumor of liver: Multiple liver nodules are consistent with metastases(www.pathology.vcu.edu/education/dental2/lab4.html). Non-invasive measurement of regional blood flow within the liver is of particular clinical interest, since changes in the tumor’s blood flow have been recognized as an important aspect for the assessment of treatment response of hepatic cancers
Many methods exist : classified in direct and indirect methods • 1) Direct methods can measure hepatic blood flow but they are invasive (exposure, cannulation) • -Microsphere method • Plethysmography method • -Electromagnetic • 2) Indirect methods can be invasive or non-invasive : • Doppler ultrasonography (operator dependant, reproducibility) • -Dynamic computed tomography • -Dilution techniques • -Radiolabelled methods Positron emission tomography with [15O]H2O tracer
PET using an intravenous bolus injection of [15O] H2O tracer permit non invasive measurement of hepatic blood flow and separate measurement of arterial and portal blood flow ROI for the liver segments (Taniguchi et al, 1999) Curves obtained after tracer injection
Kety-Schmidt model (Kety & Schmidt, 1948) This model is applicable to the study of blood flow in various organs (brain, heart) but, also in liver with modifications to reflect unique delivery environment of liver : incorporation of two separate input functions (dual-input Kety schmidt model) or using a combined input function. But the dual-input is mostly used (Taniguchi et al, 1993, 1996, Ziegler et al 1996, Munk et al 2003)
Liver has dual blood supply : Hepatic artery (arterial blood from heart) • Portal vein (venous blood) The compartmental model has to account to this two supply Scheme for general model
Hepatic artery (CA) Fa/VL Liver (CL) Fa+ FP /VL Portal vein (Cp) FP/VL Dual-input model
Hepatic artery (CA) Fa/VL Liver (CL) Fa+ FP /VL artery (CA) (portal organ ) (Cp) FP/VL Single-input model
Model parameter • Fa : arterial blood flow • Fp : portal veinous blood flow • Fa + Fp = total hepatic blood flow • CA: Tracer concentration in arterial blood • Cp: Tracer concentration in portal vein • CL: Tracer concentration in liver • VL: tracer volume of distribution in liver
The ordinary differential equation describing the tracer dynamics Assuming transport of tracer from vessel into tissue compartment is fast compared to delivery by arterial and portal-venous blood flows : tracer dynamics one-tissue compartment model with 2 different input functions. Dual input model : Single input model : And CL(t=0) = 0
Method of time delay correction (taniguchi et al, 1999) Method of time delay correction. The time delay (t) between sample site and portal organ is calculated using nonlinear regression analysis. And the hepatic blood flow is calculated using the new input function that incorporated t. Data are also corrected for dispersion
For solving model we have to had two delay parameter Ta and Tp which represent the transit time from the aorta and the portal vein regions to the liver respectively : k1a = Fa/VL k1p =Fp/VL k2 = Fa+Fp/VL
A priori identifiability (Becker et al, 2005) Investigation on the a priori identifiability of the 3 paramater Fa, Fp and VL Results indicate that the full identifiability of the model depends on the form of the portal-venous input function (cp(t)) which is assumed to be a sum of m exponentials convolved with the arterial input function (ca(t)). When m 2, all 3-model parameters are uniquely identifiable For m = 1 identifiability of Fpfails if cp(t) coincides with tissue concentration Ideally vascular input functions based on ROI derived from aorta and portal vein lead to truly measurement of blood flow with better identifiability
Conclusion Liver perfusion can be studied with PET [15O]H2O and compartmental modelling. Many articles this method combined with a dual-input one compartment model is a reproducible method that provides perfusion values. Arterial and portal-venous perfusion can be determined separately. Despite promising reports, this technique is limited by the low spatial and temporal resolution
References : 1- Kety SS & Schmidt CF. 1948. The Nitrous oxide methode for the quantitative determination of cerebral blood flow in man: theory, procedure and normal values. J. Clin. Invest. 27 476-83. 2- Taniguchi et al. Difference in regional hepatic blood flow in liver segments--non-invasive measurement of regional hepatic arterial and portal blood flow in human by positron emission tomography with [15O]H2O.Ann Nucl Med. 1993 Aug;7(3):141-5. 3- Taniguchi et al. Analysis of models for quantification of arterial and portal blood flow in the human liver using PET.J Comput Assist Tomogr. 1996 Jan-Feb;20(1):135-44. 4- Taniguchi et al. Using the spleen for time-delay correction of the input function in measuring hepatic blood flow with oxygen-15 water by dynamic PET. Ann Nucl Med. 1999 Aug;13(4):215-21. 5- Ziegler et al. Measurement of liver blood flow using oxygen-15 labelled water and dynamic positron emission tomography: limitations of model description. Eur J Nucl Med. 1996 23: 169-177 6- Munk et al. Determination of regional flow by use of intravascular PET tracers: Microvascular theory and experimental validation for pig livers. J Nucl Med 2003; 44: 1862-1870. 7- Becker et al. A priori identifiability of a one-compartment model with two input functions for liver blood flow measurements. Phys Med Biol. 2005 Apr 7;50(7):1393-404