Strategic Capacity Planning Defined
250 likes | 502 Views
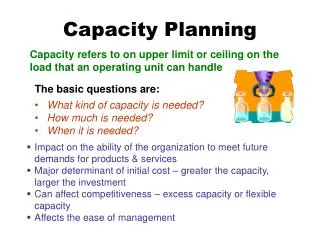
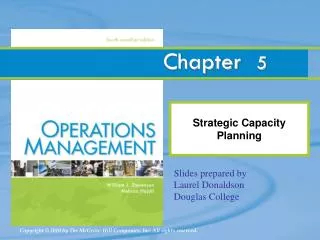
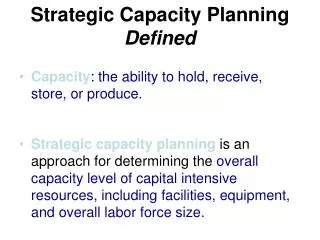
Strategic Capacity Planning Defined. Capacity : the ability to hold, receive, store, or produce. Strategic capacity planning is an approach for determining the overall capacity level of capital intensive resources, including facilities, equipment, and overall labor force size.

Strategic Capacity Planning Defined
E N D
Presentation Transcript
Strategic Capacity PlanningDefined • Capacity: the ability to hold, receive, store, or produce. • Strategic capacity planning is an approach for determining the overall capacity level of capital intensive resources, including facilities, equipment, and overall labor force size.
The Experience Curve As plants produce more products, they gain experience in the best production methods and reduce their costs per unit. Cost or price per unit Total accumulated production of units
Capacity Focus • The concept of the focused factory holds that production facilities work best when they focus on a fairly limited set of production objectives. • Plants Within Plants (PWP) (from Skinner) • Extend focus concept to operating level
Example of a Decision Tree Problem A glass factory specializing in crystal is experiencing a substantial backlog, and the firm's management is considering three courses of action: A) Arrange for subcontracting, B) Construct new facilities. C) Do nothing (no change) The correct choice depends largely upon demand, which may be low, medium, or high. By consensus, management estimates the respective demand probabilities as .10, .50, and .40.
Example of a Decision Tree Problem: The Payoff Table The management also estimates the profits when choosing from the three alternatives (A, B, and C) under the differing probable levels of demand. These costs, in thousands of dollars are presented in the table below:
Subcontract Build New No Change Example of a Decision Tree Problem: Step 1. We start by drawing the three decisions
$90k High demand (.4) $50k Medium demand (.5) $10k Low demand (.1) Subcontract $200k High demand (.4) $25k Build New Medium demand (.5) -$120k Low demand (.1) No Change $60k High demand (.4) $40k Medium demand (.5) $20k Low demand (.1) Example of Decision Tree Problem: Step 2. Add our possible states of nature, probabilities, and payoffs
$90k High demand (.4) $50k Medium demand (.5) $62k $10k Low demand (.1) Subcontract EVA=.4(90)+.5(50)+.1(10)=$62k Example of Decision Tree Problem: Step 3. Determine the expected value of each decision
$90k High demand (.4) $50k Medium demand (.5) $10k Low demand (.1) A $200k High demand (.4) $25k B Medium demand (.5) -$120k Low demand (.1) C $60k High demand (.4) $40k Medium demand (.5) $20k Low demand (.1) Example of Decision Tree Problem: Step 4. Make decision $62k $80.5k $46k Alternative B generates the greatest expected profit, so our choice is B or to construct a new facility.
Capacity Utilization & Service Quality • Best operating point is near 70% of capacity - balances efficiency and reserve • From 70% to 100% of service capacity, what do you think happens to service quality? - customers are serviced, but service quality often declines
Components of Demand • Average demand for a period of time • Trend • Seasonal element • Cyclical elements • Random variation • Autocorrelation
Delphi Method l. Choose the experts to participate. There should be a variety of knowledgeable people in different areas. 2. Through a questionnaire (or E-mail), obtain forecasts (and any premises or qualifications for the forecasts) from all participants. 3. Summarize the results and redistribute them to the participants along with appropriate new questions. 4. Summarize again, refining forecasts and conditions, and again develop new questions. 5. Repeat Step 4 if necessary. Distribute the final results to all participants.
In Class ExampleExponential Smoothing, = .4 Ft = At-1 + (1- )Ft-1
Process Planning Long- range Strategic Capacity Planning Forecasting and Demand Mgmt. Sales and Operations (Aggregate) Planning Sales Plan Aggregate Operations Plan Intermediate- range Manufacturing Services Master Production Scheduling Material Requirements Planning Weekly Workforce & Customer Scheduling Order Scheduling Short- range Daily Workforce & Customer Scheduling
Aggregate Planning • Goal: Specify the optimal combination of • production rate (units completed per unit of time) • workforce level (number of workers) • inventory on hand (inventory carried from previous period) • Product group or broad category - family (Aggregation) • Intermediate-range planning period: 6-18 months
Key Strategies for Meeting Demand • Chase - Match production to customer order rate by hiring and laying off employees • Level - Stable workforce with constant output, inventory and backlogs absorb fluctuations in demand • Some combination of the two - Stable workforce, variable hours - vary output through overtime or flexible schedules