Download
1 / 10
100 likes | 217 Views
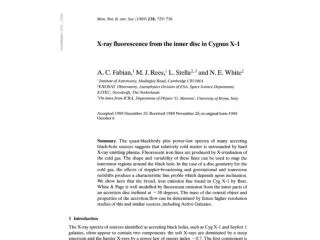
Observations Tanaka, Nandra, Fabian. Nature, 1995, 375 , 659. Galaxy MCG-6-30-15, ASCA satellite, SIS detectors. Sy 1 type The line profile of iron K line in X-ray emission from MCG-6-30-15.

E N D
ObservationsTanaka, Nandra, Fabian. Nature, 1995, 375, 659.Galaxy MCG-6-30-15, ASCA satellite, SIS detectors Sy 1 type The line profile of iron K line in X-ray emission from MCG-6-30-15. Width corresponds to 80000 – 100000 km/s. • Variability Sulentic, Marziani, Calvani. ApJL, 1998, 497, L65.
Properties of wide lines at 6.4 keV ·Line width corresponds to velocity o v 80000 – 100000 km/s MCG-6-30-15 o v 48000 km/s MCG-5-23-16 o v 20000 – 30000 km/s many other galaxies ·Asymmetric structure (profile) o two-peak shape o narrow bright blue wing o wide faint redwing ·Variability of both o line shape o intensity
Possible interpretation • ·iron K emission line o 6.4 – 6.9 – 7.1 keV • · radiation of inner part of accretion disk around a supermassive black hole in the center of the galaxy r emission 1 – 4 rg
Gallery of profilesA.F. Zakharov & S.V. Repin, Mem. SAIt, 7, 60 (2005) ; New Astronomy, 11,405(2006); astro-ph/0510548
Simulation result Overview of possible line profiles of a hot spot for different values of radial coordinate and inclination angle. The radial coordinate decreases from 10 rg on the top to 0.8 rg on the bottom. The inclination angle increases from 85 degrees in the left column to 89 degrees in the right. Zakharov A.F, Repin S.V. A&A, 2003, 406, 7.