Download
1 / 21
210 likes | 400 Views
Social Network Analysis Lecture 5/ Assignment 1 Advice networks and Innovation U. Matzat. Innovation in Networks: course structure. Part I: introduction and theory Part II: techniques of (social network) data analysis

E N D
Social Network AnalysisLecture 5/ Assignment 1Advice networks and InnovationU. Matzat
Innovation in Networks: course structure • Part I: introduction and theory • Part II: techniques of (social network) data analysis • Part III: empirical applications of social network analyses in innovation science and alliance management • [1] advice networks and innovation (UM) • [2] student networks (CS or GR) • Part IV: specialization: manager networks, industry networks, citation networks, etc.
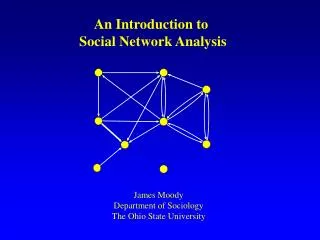
Complete Networks The relations of all actors are taking into account Existing data (archival) Case study (f.i. a family or this class) Ego centered network Network from the perspective of the actor Extension of traditional survey instruments Random sampling possible Standard statistical analysis possible A Recap: Two Approaches to Network Analysis
The Assignment: • We analyze What makes it more likely that an entrepreneur introduces a new product or service to the market?? • the case: Uganda.
Uganda: • 31 million inhabitants • substantial natural resources, including fertile soils, regular rainfall, and sizable mineral deposits of copper and cobalt • Agriculture most important sector of the economy, employing over 80% of the work force • Christians made up about 84% of Uganda's population in 2002 • young population, with a median age of 15 (!)years
Uganda: • During 1990 - 2001, the economy grew because of • continued investment in the rehabilitation of infrastructure, • improved incentives for production and exports, • reduced inflation, • and gradually improved domestic security • Growth for 2001 - 2002 was solid despite continued decline in the price of coffee • in 2004 Uganda's GDP per-capita reached $300, a much higher level than in the Eighties but still at half of Sub-Saharan African average income of 600 dollars per year
The Assignment • Think of ways in which the ego-centerd network of an entrepreneur may influence • the likelihood of product or service innovation • Derive at least two hypotheses. Make use of ideas of Burt's (2001, 2004) theory of structural holes and of another social network theory. • Test those hypotheses using the dataset we provide. • SPSS data set “entrepreneurs-2008.sav”: • File contains 724 cases (rows) • information about the entrepreneur, his/her demographic background, his/her ego-centered network characteristics, personality, and characteristics of the market.
The report • report must resemble a scientific article • Introduction [10 points] • products and service innovation by entrepreneurs and why social networks might play a role in explaining them • Theory [30 points] • theoretical framework, derive at least two hypotheses concerning the effect of two ego-centered network characteristics on the emergence of innovating behavior • Method [15 points] • Describe the data, the measurements, and the statistical methods. • Results [25 points] • Present descriptives/the results of the analysis, by means of table/picture, and a verbal clarification of the table/picture. • Discussion/Conclusion [20 points] • What do the results say about your theory? Would it make sense to run other analysis? How could one improve this study? How valid/reliable are its results? Implications?
The theory • Read Burt (2004): Structural Holes and good Ideas, AJS • Read earlier articles on social network theories • Optional: look for additional articles/theories • Formulate a (ego-centered) social network theory that explains why some entrepreneurs are more likely to innovate than others. • Be clear • Use sound arguments • Be creative
Logistics • You can work in groups of two or three students, provide names and student ids on the report • Plagiarizm will be punished • DEADLINE: October 14, 18:00 • WORD-ATTACHMENT EMAILBOX Uwe Matzat (umatzat@gmail.com) and Chris Snijders (c.c.p.snijders@gmail.com ) • I am available for questions: • IPO 1.32/ umatzat@gmail.com
The data set • Information about innovating behavior of 724 entrepreneurs in Uganda, demographic background, personality, market characteristics
THE NETWORKS From time to time, entrepreneurs seek advice on important business matters. Looking back over the last six months– who are the people with whom you discussed an important business matter?
THE NETWORKS Please think about the relationships between the people you just mentioned. For each contact, ask if this contact is a STRANGER (S), CLOSE (K) OR ESPECIALLY CLOSE (EC) to the other persons. Maybe another way to calculate density makes more sense? (see SPSS job)
The data preparation • Select the dependent variable: INNOVATION (summary of IN1-IN4) • Calculate (compute) some network characteristics • Include a limited number of control variables (personality, demographics, characteristics of the market, etc.)
The data preparation • You only have to work with SPSS! • However, you definitely have to transform the given data set, for example by creating new variables with the “compute” command within SPSS. So a considerable amount of work consists of data recoding and data transformation to compute the appropriate network characteristics that you think are important. • Have a look at the hints for measuring network characteristics: “network calculations” at the course website • Have a look at examples of spss jobs • Adjust them to your needs!
The data analysis • Descriptives: mean, standard deviation, distribution when appropriate • Testing the hypotheses: correlation and multivariate regression (including a limited number of control variables)
Work load • The data preparation takes a lot of time! • You have to get acquainted with the data. Play around with it. • Start immediately. If you start just 4 or 5 days before the deadline, you are likely to fail. • Writing in clear ways takes time. • The value of your report does not depend on the number of hypotheses that find support.
The assignment QUESTIONS?