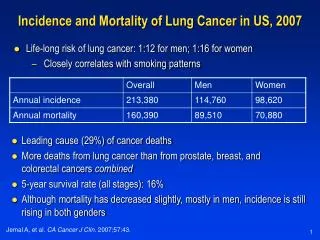
Download
1 / 36
360 likes | 479 Views
Matt Laurin - Morehead State University E-mail: mrlaur01@morehead-st.edu Aaron Pierce - Morehead State UniversityE-mail: anpierce@moreheadstate.e du. Mapping Geographical Clusters of Lung Cancer Mortality Rates. Timothy S. Hare IRAPP, MSU 414C Bert Combs Building Tel. 606-783-9436

E N D
Matt Laurin - Morehead State University E-mail: mrlaur01@morehead-st.edu Aaron Pierce - Morehead State UniversityE-mail: anpierce@moreheadstate.edu Mapping Geographical Clusters of Lung Cancer Mortality Rates Timothy S. Hare IRAPP, MSU 414C Bert Combs Building Tel. 606-783-9436 E-mail: t.hare@morehead-st.edu 1
LISA Cluster Map – Mortality - All Causes – Moran’s I 0.520***
Research Questions • Are mortality rates due to lung cancer distributed evenly across central Appalachia? • What factors are associated with elevated mortality rates due to lung cancer? 7
Key Tasks • Identify meaningful clusters of high mortality rates. • Use techniques of ESDA to characterize associated factors. • Examine the effects of factors on spatial clusters of high mortality rates. 8
Data & Methods Data • SeerStat • Health Care Services • AHA Annual Survey • Additional surveys & questionnaires • Area Resource File • Socioeconomic Data - Census Methods • Spatial Aggregation • County-level (598) • Mortality Rates • Temporal Aggregation • Direct Standardization • Age-Adjusted Rates • Year 2000 U.S. Standard Population • Travel time calculations 9
Analysis Techniques • Map visualization • Univariate & Bivariate Moran’s I • Local Indicators of Spatial Autocorrelation • Spatial Regression (lag & error models) • Geographically Weighted Regression 10
Research Question 1 • Are mortality rates due to lung cancer distributed evenly across central Appalachia? 11
Female vs. Male Lung Cancer Mortality Multivariate LISA Cluster Map Moran’s I = 0.3700 p < 0.001
Spatial Autocorrelation: Moran’s I Note: *** P < 0.001, ** P < 0.01, * P < 0.05
Research Question 1 • Are mortality rates due to lung cancer distributed evenly across central Appalachia? - No 18
Research Questions 2 • What factors are associated with elevated mortality rates due to Lung Cancer? 19
LISA Cluster Map - Household Health Care – Moran’s I 0.579***
Bivariate Moran’s I vs. Total Mortality for Lung Cancer Note: *** P < 0.001, ** P < 0.01, * P < 0.05
OLS Regression Model 1 Adjusted R-squared: 0.328321 Akaike info criterion: 4677.76 Note: *** P < 0.001, ** P < 0.01, * P < 0.05
Spatial Regression Model 1 (Lag) R-squared: 0.49796 Akaike info criterion: 4575.46 Note: *** P < 0.001, ** P < 0.01, * P < 0.05
Comparison of OLS & Spatial Lag Regression R-squared: 0.49796 Akaike info criterion: 4575.46 Adjusted R-squared: 0.328321 Akaike info criterion: 4677.76 Note: *** P < 0.001, ** P < 0.01, * P < 0.05
Results • Mortality rates due to lung cancer are not distributed evenly across central Appalachia. • All examined factors are associated with elevated mortality rates due to lung cancer. 33
Future Investigations • Further explore differences by sex • Deal with multicollinearity • Create composite deprivation index • Examine service utilization patterns • Examine • Tobacco use • Air quality 34
Questions?! 35
Thank You Thanks to: TheNational Center for Health Statistics for the mortality data. This Research is supported in part by: An MSU Faculty Research Grant KBRIN-NIH Research Grant The Institute for Regional Analysis and Public Policy Booth Endowment Research Grant Institute for Regional Analysis and Public Policy (IRAPP) Center of Excellence, MSU AKentucky Program of Distinction http://irapp.morehead-st.edu 36