Download
1 / 30
310 likes | 333 Views
This research focuses on predicting urban water quality based on multi-source data. The study addresses the complexity and global applicability challenges in existing solutions. By incorporating spatial and temporal information, the proposed methodology aims to improve the accuracy of water quality predictions. The study evaluates the model performance and establishes its validity through various tests.

E N D
Urban Water Quality Prediction based on Multi-task Multi-view Learning Presented by: Tyler Pietri, Dennis Silva, Michelle Lin
Content Background: Problem & Motivation Methodology Evaluation Conclusion
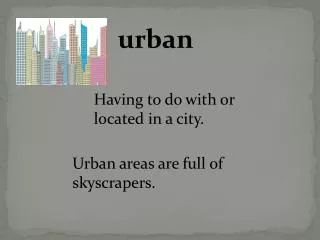
Background Urban water quality consists of: Physical (debris) Chemical (residual chlorine, turbidity, pH Level) Biological (bacteria, algae) Radiological (iodine-131)
Background Water quality issues related to urban development:Urban Runoff (Nitrogen & Phosphorus) Sediment Buildup Population Growth Sewage Overflows Waterborne Pathogens
Background Contaminated water = significant issue 131M people drink contaminated water in USA
Healthy populace Informed policy Urban projects Existing Solutions Fail to address complexity Localized predictions Lack of global applicability Motivation
Existing Solutions Can you more accurately predict water quality by assuming water quality is correlated?
Heterogeneous Multiple sources • Spatial • Temporal Shenzhen, China Spatial • Road network • Pipeline network • POI Temporal • Water quality • Weather Data
Temporal View - a single feature vector The latest 12 hours temporal data in a station. Time Series Signal. Water quality (RC, Turbidity, pH) Water hydraulic data (flow, pressure) Meteorological features: temperature, humidity, barometer pressure, wind speed, weather
Spatial View Water pipe network structures (length, diameter and age) Road network structures (road segment density, road length) POIs (distribution) k nearest neighbors (water quality and hydraulic characteristics) i.e. Neighbors’ temporal features via the geographical similarity (the sum of top-k shortest paths between stations)
Prediction Model Spatial prediction Temporal prediction W is the linear mapping function for station l Assume both contribute equally, the prediction model
Objective function Considering the least-squares loss function Inherent characteristics of the same node from various aspects This penalty enforces the agreement on the prediction results
Objective function - includes the global impact on a station This Graph Laplacian penalty ensures a small deviation between two nodes that are near in the pipeline system. Sl,m measures the spatial autocorrelation between l and m. If it is large, the penalty will force similarity between l and m.
L2,1-norm of W(the weight matrix over nodes) D: # of features M: # of nodes Group Lasso penalty. It encourages all tasks to select a common set of features and thereby plays the role of group feature selection.
Optimization The objective function can be written as h(W) is smooth, g(W) is non-smooth. Use the Fast Iterative Shrinkage Thresholding Algorithm (FISTA) or Accelerated Gradient Descent.
Evaluation Focus Model Performance • RSME • Varied prediction intervals Assumption Soundness • Single task • Multitask
stMTMV = ↓ Error ↑ Interval = ↑ Error Close approximate of known values Model Performance stMTMV vs. Alternatives stMTMV vs. True Output
Varied inputs Inclusive model = best model Proved • water quality = interconnected • Spatial-temporal element Assumption Validity stMTMV vs. stMTMV Varients
Varied Views • Temporal (t) • Spatial (s) • t+s without alignment • t+s with alignment Proved • Spatial-temporal element • Alignment is necessary Assumption Validity stMTMV vs. views
Conclusions and Future Work • Explore stMTVT model using different prediction functions • Nonlinear, convex, etc. • Apply model to varied problem (traffic)
References Liu, Ye, et al. "Urban water quality prediction based on multi-task multi-view learning." Proceedings of the International Joint Conference on Artificial Intelligence. 2016."Safe Water Is a Scarce Commodity Worldwide." Statista. N.p., n.d. Web. <https://www.statista.com.ezproxy.wpi.edu/chart/4591/drinking-water-world-water-day/>Wright, Paul. "5 Infographics That Show The Need For Drinking Water Testing." SCIEX. N.p., n.d. Web. <https://sciex.com/community/blogs/blogs/5-infographics-that-show-the-need-for-drinking-water-testing>.Survey, U.S. Geological. "Water Resources of the United States." Water Resources of the United States: U.S. Geological Survey. N.p., n.d.. <https://www2.usgs.gov/water/>.