Download
1 / 29
290 likes | 387 Views
This document provides detailed instructions for conducting a density of pennies lab, including procedures, data collection, graphing, analysis, and writing a lab report.

E N D
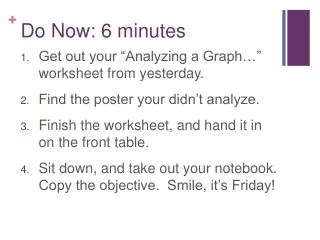
Do Now: 6 minutes • Get out your “Analyzing a Graph…” worksheet from yesterday. • Find the poster your didn’t analyze. • Finish the worksheet, and hand it in on the front table. • Sit down, and take out your notebook. Copy the objective. Smile, it’s Friday!
Intensive vs. extensive properties • Intensive property: a physical property that does NOT depend on how much of a substance you have. • Ex: temperature, velocity, melting point • Extensive property: a property that DOES depend on how much you have. • Ex: mass, length, volume
Intensive or extensive? • I weigh 130 pounds. • The car is moving 50 miles per hour. • The length of a marathon is 24.6 miles. • The density of water is 1.0 g/mL • Ice melts at 0oC. • I drank one liter of soda. (burp!)
Density • A physical property of matter • The mass per volume of a substance. • Units: g/mL or g/cm3 • 1 mL = 1 cm3
Calculate Density • Mass = 10.0 g, volume = 20.0 mL • 10.0 g, 5 cm3 • Calculate the mass of a sample of matter with a volume of 10.0 cm3 and density of 2.0 g/cm3 • Calculate the volume of a rock with mass 100.0 g and density 5.00 g/mL.
Homework • Week 6 Homework, #5-6
The phenomenon • In 1982, the density of pennies changed.
Your challenge: • Determine, empirically, the density of pennies before and after 1982. • Write a materials list and procedure. Include ALL your steps. Be thorough! • Carry out your procedure. • Record and organize data into a chart and graphs. Describe your data in a paragraph. • Analyze your data in a paragraph. • Make a conclusion summarizing your data and answering questions.
Some details • How can you determine the volume of a penny? • Displacement • Calculate the density of 2, 3, …10 pre-1982 pennies, and 2, 3, …10 post-1982 pennies. Make a neat table and graph.
An example of a good table.Table 1: Mass, volume and density of pre-1982 pennies
Things to write in your notebook: • An excellent materials list and procedure • Complete data tables (title, headings, units, calculations, NEATLY!) • Complete graphs: mass vs. volume and EITHER mass vs. density or volume vs. density, with title, axis labels and units • A written description of your data. • A written analysis of your data • A conclusion based on guiding questions.
Your homework • To write a lab report. • First Draft (neatly hand-written or typed) due:
So, is density intensive or extensive? How do you know? Discuss your graph, and what a graph of the other type might look like.
By the end of class… • Materials list and procedure (incl. how to make calculations!) • Data table for pre- and post-1982 pennies • 2 graphs: mass vs. volume AND either • Mass vs. density OR volume vs. density • With a sentence describing each graph. • You can start an analysis and conclusion like we practiced yesterday.
Homework • Week 6 Homework: #5-6 • 2 graphs: mass vs. volume AND either • Mass vs. density OR volume vs. density • With a sentence describing each graph. • You can start an analysis and conclusion like we practiced yesterday.
With your group: • Fix your graphs. Draw a best-fit line. • Write a one-paragraph analysis for each graph. Describe BOTH lines for each graph. • Trend • Shape of line • Outliers: points that are way off the line.
Title • Your lab report should be titled with a title of your choosing. • It should be relevant to the lab and should not just be the same as the title of a handout your teacher gave you. • Do not have it on a separate title page.
Background Information • Explain any important concepts that are central to understanding the experiment. • In paragraph form, define any scientific terms necessary for understanding the lab.
Objective (NO hypothesis) • Explain what the purpose of the experiment or what goals you have in completing the lab. What do you hope to accomplish? • (No hypothesis) • IV: number of pennies • DV: density
Write a Lab Report • Title (incl. name, data, partner’s names) • Objective (no hypothesis) • Background info (from notes, etc.) • DUE TOMORROW
Procedure • For a lab where you have designed the procedure, include a detailed and complete account of every single step you completed during the lab, including how to make calculations. Be sure to include proper names for pieces of equipment! • If you have followed a procedure given by your teacher, write a summary of what you did. Do not rewrite the given procedure word for word.
Data and Results • Include any charts, graphs, tables, technical drawings, observations, or diagrams in this section. Include a one sentence caption for each. • Data should be presented neatly, and with the use of computer software when possible. • If any calculations were necessary during this lab, include them here. • DO NOT explain the data.
Analysis • Describe any patterns or trends in the data. Point out any relevant characteristics and comparisons that you see. Do not attempt to explain them, simply note them. • Note the existence of any data that does not seem to fit the overall patterns/trends.
Conclusions • Draw conclusions from the patterns and observations you noted in the analysis section. Explain why the patterns you saw occurred. • Was the experiment successful at completing the objectives above? Explain why or why not. • Reflect on your hypothesis. Was it correct? Why or why not? • Was there any significant error in your experiment? Propose some possible sources of error and explain how they might be improved. • Answer questions (4) in lab handout in paragraph form.
On a separate sheet of paper… • Write the first draft of your lab report. • Work on your own. • You may listen to music as long as I can’t hear it. • Label each section. • Be careful to include EVERY part listed in your lab report guide. • First draft due: next Thursday, Oct. 22