Download
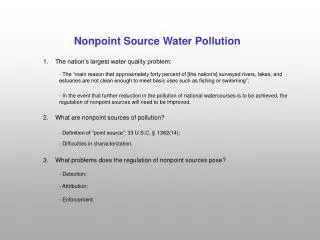
1 / 20
200 likes | 305 Views
Explore the history, present efforts, and future plans of nonpoint source watershed management in the Mid-Atlantic region. Learn about funding, achievements, and progress towards NPS reduction goals. Discover success stories and strategies for restoring NPS-impaired waterbodies.

E N D
Nonpoint Source Watershed Planning and Implementation in the Mid Atlantic Region “The source and the solution point to us.” Chesapeake Bay Program Meeting June, 2008
Program: Past – Present – Future • Where have we been? • Where are we now? • Where are we going?
Where have we been? • CWA amended in 1987 to include Section 319 • Initial 319 Management Plans approved in 1989. First grant award 1990. • 1990 CZARA • 1997 Guidance revised in concert with ASIWPCA • 1999 CWAP, funding doubled • 2000 New Management Plans approved • 2000-2003 Guidance more outcome based
NPS Program Funding National Federal NPS 319 total over $1.8 billion Region 3 Federal NPS 319 total over $238 million Region 3 State NPS match over $158 million Region 3 Total NPS $396 million National Annual Budget
N, P & S Load Reduction Achieved • For 319 Funded Projects Only • Reporting Mechanism • State - GRTS
National Environmental Indicators 2004 vs 2005
Region 3 Contribution Towards The National NPS Reduction Goals for 2006
Program: Past – Present – Future • Where are we now?
TMDL Allocations Achieved • BMP load reductions compared to TMDL Allocations • Reporting Mechanisms • State – Grants Reporting & Tracking System • State - Annual Reports • EPA – Watershed Information Tracking System • TMDL Database
Program: Past – Present – Future • Where are we going?
NPS Waterbodies Partially or Fully Restored • NPS Waterbody is defined by 303(d) listing, primarily NPS impaired • Restoration • Partial • Full • Reporting mechanism • Success Stories Web Site • State Annual NPS Report • Assessment Data Base/Integrated Monitoring Guidance Report
NPS Waterbodies Partially or Fully Restored2008 2012 • DC 2 NC • DE NC NC • MD NC 12 • PA 4 7 • VA 4 7 • WV 3 5