Download
1 / 17
170 likes | 368 Views
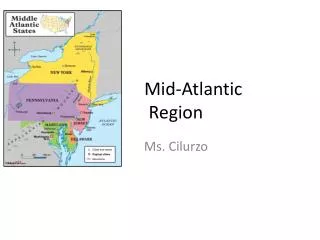
The Value of Air Quality Forecasting in the Mid-Atlantic Region. Gregory Garner – Penn State Meteorology Advisers: Anne Thompson, William Ryan. 2011 National Air Quality Conference: San Diego, CA March 10, 2011. The problem…. Adapted from Yorks (2009). Adapted from Tang et al. (2008).

E N D
The Value of Air Quality Forecasting in the Mid-Atlantic Region Gregory Garner – Penn State Meteorology Advisers: Anne Thompson, William Ryan 2011 National Air Quality Conference: San Diego, CA March 10, 2011
The problem… Adapted from Yorks (2009) Adapted from Tang et al. (2008) Charlotte, NC (Eder, 2010)
…so is it valuable? Do Not Protect Protect Cost 0 Good Bad Cost Loss Cost Loss • How to assess the value of a forecast system? • The “Umbrella Problem”
Cost? Loss? Ok…now what? • “How much would I expect to lose on any given day?” • Protect • Do not protect • …and if you had to choose • ( Prob {Good} x Cost ) + ( Prob {Bad} x Cost ) • = ( Prob {Good} + Prob {Bad} ) x Cost • = Cost • ( Prob {Good} x 0 ) + ( Prob {Bad} x Loss ) • = Prob {Bad} x Loss • Minimum ( Cost, Prob {Bad} x Loss )
Where does the forecast come in? • You can make a better decision with a forecast! • No forecast • Forecast • Prob {Bad} Climatological probability that a Bad event occurs • Prob {Bad} Probability that a Bad event occurs with the given forecast
…but what about “Value”? • You expect to lose with climatology… • You expect to lose with the forecast… • So the difference between the two is the value!
A little more on “Value” VALUE! $ • Expected “Value” of the forecast system depends on the probability of a forecasted “Bad” event • Sum this up over all levels above the threshold:
Interpreting Value ? Cost Loss • Value (V) is a function of Cost and Loss • A ratio of Cost to Loss (C/L) is used to calculate V • Value as the “percent savings from climatology” • C/L as actions or “protective measures”
Data • 41 sites, 9 forecast regions (overlap) • DDOE, MDE, VADEQ • 3 forecast systems • NAQFC, Human, Persistence • Convert to AQI to set thresholds for value calculation
Summary / Future Applications • Assess value of forecasts with cost-loss ratio model • Biased model still has value • Although human forecasters prevail! • Variability of value in time and space • General methods Many applications • Evaluation tool for NAQFC – MOS • Monitor-location optimization
Acknowledgements • Data provided by • Maryland Department of the Environment • District Department of the Environment • Metropolitan Washington Council of Governments • Virginia Department of Environmental Quality • NOAA – National Operational Model Archive and Distribution System • Bill Ryan (PSU), Duc Nguyen (MDE), and Laura Landry (MDE) • Valuable insight into AQ forecasting operations • This study was funded by NSF DRU Program Award I.D. 0729413 with added support from NASA’s Tropospheric Chemistry Program and Aura Validation.
References R Development Core Team (2010). R:A language and environment for statistical computing. R Foundation for Statistical Computing, Vienna, Austria. ISBN 3-900051-07-0, URL http://www.R-project.org/. Original S code by Richard A. Becker and Allan R. Wilks. R version by Ray Brownrigg. Enhancements by Thomas P Minka (2010). maps: Draw Geographical Maps. R package version 2.1-5. URL http://CRAN.R-project.org/package=maps. Thomas Williams, Colin Kelley et al. (2004): gnuplot. URL http://gnuplot.info Berger, J. O., 2006: Basic concepts. Statistical Decision Theory and Bayesian Analysis, Springer Science+Business Media LLC, 2d ed., 1–34. Eder, B., et al., 2010: Using national air quality forecast guidance to develop local air quality index forecasts. Bulletin of the American Meteorological Society, 91 (3), 313–326, doi:10.1175/2009BAMS2734.1. Katz, R. W. and A. H. Murphy, 1997: Forecast value: prototype decision-making models. Economic Value of Weather and Climate Forecasts, Cambridge University Press, 183–217. Tang, Y., et al., 2008: The impact of chemical lateral boundary conditions on cmaq predictions of tropospheric ozone over the continental united states. Environ. Fluid Mech., doi:10.1007/ s10652-008-9092-5. Thompson, J. C. and G. W. Brier, 1955: The economic utility of weather forecasts. Mon. Wea. Rev., 83, 249–254. Thornes, J. E., 2001: How to judge the quality and value of weather forecast products. Journal of Applied Meteorology, 8, 307–314. Yorks, J. E., et al. 2009: The variability of free tropospheric ozone over Beltsville, Maryland (39N, 77W) in the summers 2004–2007. Atmospheric Environment, 43, 1827 - 38
Extra(s) • Extra slide(s) to follow…