Download
1 / 16
160 likes | 174 Views
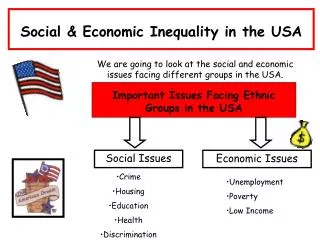
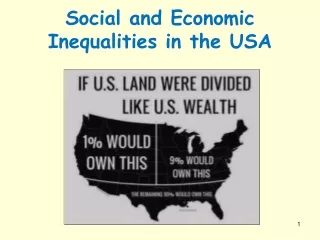
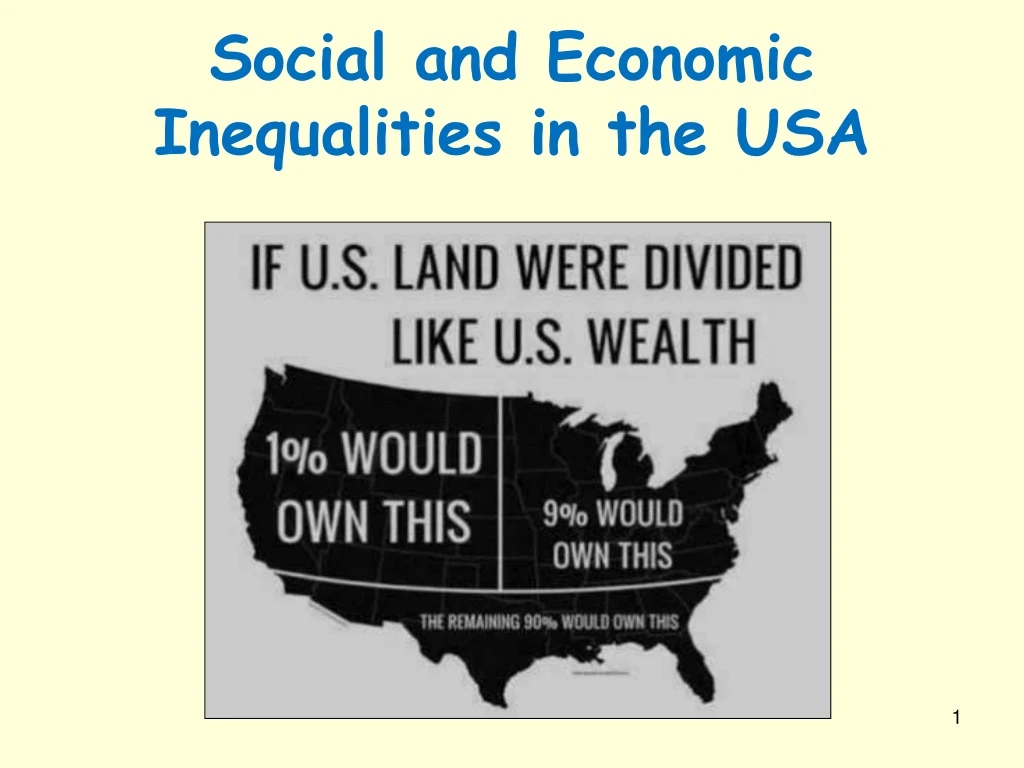
Explore income and employment inequalities in the USA, reasons behind them, and impact of family structure on inequalities. Detailed analysis and statistics provided on poverty rates, unemployment figures, and their impact on various ethnic groups.

E N D
Today we will… • List statistics which highlight income and employment inequalities. • Identifyreasons why these inequalities exist. • Explainhow family structure can lead to inequalities.
Success criteria… • I can examine statistics which highlight inequalities. • I can explain the reasons for inequalities.
Income and Poverty • In 2012 the official poverty rate was 15%. • 46.2 million people were living in poverty. • The official poverty rate in 2016 was 12.7% - showing poverty is decreasing although not particularly quickly.
Poverty The U.S. Census Bureau's poverty threshold for a family with two adults and two child was $24,858 in 2017. This is the official measurement of poverty used by the Federal Government, and the measure used for most poverty-based data presented on State Health Facts.
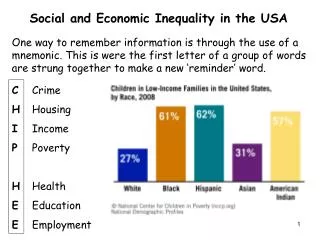
Poverty • So from the table on the last slide, in 2012… • 15% of Americans lived in poverty • 27.2% of African Americans in poverty • 25.6% of Hispanic Americans in poverty • 9.7% of non-Hispanic whites in poverty Analysis: So, in 2012 blacks were almost 3 times as likely to be living in poverty compared to whites.
Poverty In 2016 (the most recent figures for all groups) show that… • 12.7% of Americans lived in poverty • 22% of African Americans in poverty • 19.4% of Hispanic Americans in poverty • 8.8% of White Americans in poverty • Analysis: So in 2016 blacks were still 3 times as likely to be living in poverty compared to whites.
Poverty • The National Centre on Poverty reported that 13 million American children were living in families with incomes below the official federal level. • Black and Hispanic Americans are more likely to be living in poverty therefore experience more social and economic inequality compared to Asian and White Americans. Struggling to make ends meet: Hidden America What poverty in America looks like
Family Structures and the Ghetto Among the African-American population, there has been a greater breakdown of family structure than in other ethnic groups: over 80% of children in ghetto areas are born into single parent families. As the single parent is usually the mother, children grow up without an adult male as a role model. As a result some African American boys get involved in antisocial behaviour in the community which leads to dropping out of school. There is a growing dependency culture and not many males of working age actually work in ghettos.
Single Mother Poverty Poverty rates are higher for single mothers from minority backgrounds. In 2010 the poverty rate was 50.3% for Hispanic single mothers. It is estimated that as many as half of US children may live in a single parent family at some point in their childhood.
Unemployment • At the end of 2014, the USA’s national unemployment rate was 5.5%. In comparison by October 2017, the national unemployment rate was 4.1%. The latest figures for September 2018 show the national unemployment rate is 3.7%. • Today, around 3.9% of white Americans and 3.3% of Asian Americans are unemployed compared to 6.5% of African Americans. 4.5% of Hispanics are currently unemployed (Oct 2018) which shows that minorities are more likely to be unemployed. • Analysis - Blacks are almost twice as likely to be unemployed as whites. In 2014, the unemployment rate for African Americans was as high as 10.5%.
Unemployment Figures Oct 2018 Further analysis: It can clearly be seen that even as overall unemployment in the USA falls across all groups, ethnic minority groups are still far more likely to be unemployed. Unemployment drops but Americans still aren't happy
Employment Unemployment rates among ethnic minorities remains high Roughly 6.5 million Americans remain unemployed Employment Inequalities Economic inequality caused by unemployment clearly links to education/health inequalities Discrimination/ lack of skills is a huge barrier for many ethnic minority citizens
I can… • I can examine statistics which highlight inequalities. • I can explain the reasons for inequalities.