Download
1 / 121
1.21k likes | 1.26k Views
Capitalism in the USA benefits individuals and groups economically but contributes to wealth inequalities, leading to social disparities such as housing and income gaps. Learn about the impact of capitalism and inequality in the American society.

E N D
Capitalism • Individuals and groups are free to make money – start businesses etc… accumulate wealth • This largely benefits the individuals/groups but theoretically the public should also benefit through cheaper goods/job creation etc. • Critics would argue that capitalism benefits individuals/share holders but NOT SOCIETY AS A WHOLE – this is because many companies avoid paying tax etc. • Also, the main beneficiaries of capitalism are company owners/share holders who can make huge profits which the public do not always benefit from • Capitalism leads to wealth inequalities – rich and poor • Capitalism leads to “boom and bust” system
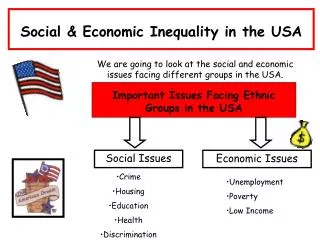
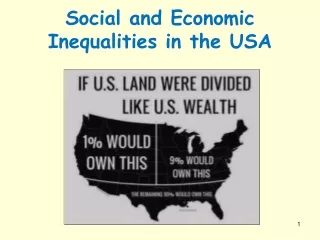
Social and Economic Inequalities • An inequality is an example of where people are NOT EQUAL • SOCIAL inequality is about how people are not equal in SOCIETY • ECONOMIC inequality is more to do with how people are not equal FINANCIALLY • The two are however very much linked…there are many social inequalities in housing for example with some people in the US living in fancy houses and others in poor slums, but it is perhaps the result of economic inequalities – i.e. the amount of money a person makes affects their ability to live in a nice home/area.
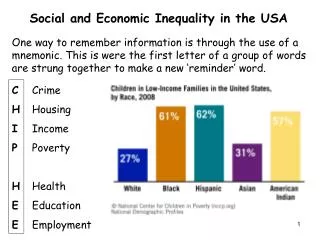
Social and Economic Inequality in the USA One way to remember information is through the use of a mnemonic. This is were the first letter of a group of words are strung together to make a new ‘reminder’ word. C H I P H E E Crime Housing Income Poverty Health Education Employment
In the exam… • Questions in the exam will either ask you about: • The extent of social and economic inequality • Government responses to social and economic inequality
Background Knowledge • The United States is a capitalist country. • Capitalism is an economic system in which trade, industries, and the means of production are largely or entirely privately owned and operated for profit. • The USA is a country with a strong capitalist ethic and favours minimal state intervention – individualist rather than collectivist (see next slide). • The opportunity to become rich is part of the American Dream. Many Americans believe in the American Dream and there are thousands of people who have achieved it. • However, for every ‘winner’ there are many more ‘losers’. • In terms of income, it seems that minorities suffer inequality – especially African Americans and Hispanic Americans.
Background Knowledge • Individualist approach: (USA,Australia) • Lower taxes (In 2016 USA paid 26% of GDP in tax, lowest in developed world) • Little or low level welfare payments (benefits) – state pensions, unemployment benefit, maternity pay etc. • Health care based on personal insurance or ability to pay. • Low levels of government support for childcare, housing and support for older people. • Collectivist approach: (Norway,Sweden,Denmark) (video link) • Higher taxes (In 2016 Denmark paid 47% of GDP in taxes, highest in developed world) • High level of government welfare payments (benefits) – well paid state pensions, unemployment and maternity pay • Health care based on taxes and access for everyone. • High levels of government support for childcare, high spending on social (council housing)
Unemployment • At the end of 2017, 3.9% of Americans were unemployed, but the figures for different ethnic groups vary greatly. • At the end of 2017, around 3.4% of Whites and 2.8% of Asian Americans are unemployed compared to 7% of African Americans – so African Americans are twice as likely to be unemployed as whites. • 4.7% of Hispanics are unemployed which again shows that some minorities are more likely to be unemployed.
Income • Compared to other developed countries, the USA is a very unequal society. According to the UN , the Gini coefficient (which gives a measure of wealth or income inequality within a country) for the USA is 47 and rising (UK 45). • What this means is that the richest people in the USA have, on average, a far greater share of the total income or wealth than the poorest people. • Ethnicity is crucial when looking at social and economic inequalities in the USA. • White and Asian Americans are most likely to have higher incomes and be employed. • African Americans and Hispanic Americans are least likely to have high incomes and be employed.
Income • In 2012, among the ethnic groups, Asian households had the highest average income which stood at $68,636. The average income for White households was $57,009, and it was $33,321 for Black households. For Hispanic households the average income was $39,005. • In other words, on average, Asian Americans earn more than twice as much as black Americans. • Also, on average black Americans earn about 58% of what white Americans earn. • Clearly, there is extreme economic inequality for black and Hispanic Americans compared to white and Asian Americans. • The 1% • Over the last 8 years the incomes of the top 1% of Americans grew by 37% compared to a 7% increase for the other 99%
Poverty • Poverty rates in the USA are high for a developed country. • 15% of the US population were classed as living in poverty in 2012. • The table on the next slide shows the extent of poverty for different ethnic groups…
The Worst of Both Worlds The USA has the highest level of income inequality and worst health/social problems amongst the worlds richest countries.
Poverty • So from the table on the last slide, in 2012… • 15% of Americans lived in poverty • 27.2% of African Americans in poverty • 25.6% of Hispanic Americans in poverty • 9.7% of non-Hispanic whites in poverty • So, in 2012 blacks were almost 3 times as likely to be living in poverty compared to whites.
Poverty • The official measure of poverty is the Federal Poverty Line. • Millions of Americans in 2015 live below the poverty line. • The National Centre in Poverty reported that 13 million American children were living in families with incomes below the official federal level. • Black and Hispanic Americans are more likely to be living in poverty therefore experience more social and economic inequality compared to Asian and White Americans.
African-American Poverty • Reasons for the high levels of poverty are different. Black Americans have suffered systematic and long-term discrimination. Many have also fallen victim to the poverty cycle. • The level of black poverty has steadily decreased over the years. However, black Americans do still experience greater inequality than white Americans or any other ethnic group. • This has resulted in a Black “underclass” living in ghettos where they find it more difficult to get a proper education, employment, health and even justice in the courts. • This has led to a rise in crime and substance abuse. African Americans are the biggest group reliant on welfare.
Black Middle Class • However - • there has been a rise in a black middle class due to better access to education and well paid jobs e.g. over the last 40 years the number of black lawyers, although still low, has doubled from 2% to 5% of the total. • In 2015, 38% of black Americans were considered to be middle class (earning between $35K -$100K) • The number of African Americans making at least $75,000 per year more than doubled from 1970 to 2014, to 21%. Those making $100,000 or more nearly quadrupled. • Many have integrated into white neighbourhoods and there has also been a development of black middle class neighbourhoods. e.g. Atlanta and Los Angeles have thriving black middle class areas with high house prices and sought after schools.
Case Study: Black Middle Class • The Queens district of New York is home to black middle class families whose average income was higher than that of white families in the same area. This was largely due to the growth of two-parent families. • Today middle-class black Americans are well established as a separate community and do not have to live side by side with lower income black Americans - those that are left behind in the ghetto, left to deal with drugs, violence and crime.
Hispanic Poverty • The reasons for poverty amongst Hispanics are different. Mainly due to immigration from South and Central America. • Poverty levels are not equally distributed amongst the Hispanic groups. Mexicans and Puerto Ricans have higher poverty levels than Cubans. • Mexicans and Puerto Ricans represent the economic migrants who are in search of the American Dream, whereas Cubans have a strong tradition of being successful in business.
State ‘millionaire taxes’ • However - • Over the last 10 years a number of states governed by the Democrats have introduced extra taxes for millionaires. • These taxes show an attempt to reduce income inequality and bring in extra revenue from the wealthy to improve public services such as schools, public transport and healthcare. • In California, the state with the largest population, those earning over $1 million dollars pay an extra 4% in state income tax (13% in total). • In New York state millionaires pay an extra 2% in tax (9%.in total.)
Video Clips… • https://www.youtube.com/watch?v=wNNBjqdKZRQ – wealth inequality stats • http://inequality.org/tax-rich-animated-fairy-tale/ - animation about wealth inequality in USA
Park Avenue: Money, Power and the American Dream • http://inequality.org/park-avenue-money-power-american-dream/
Examples of rich and poor neighbourhoods in the USA? • Compton in Los Angeles, California (poor) • Harlem in New York City, New York (poor) • Newport Beach, Orange County, California (rich) • The Hamptons, Long Island, NY (rich) • Upper East Side of Manhattan, NYC, NY (rich)
Education • There are huge inequalities in education in the USA. • These are largely because of income and this again means that minorities are worst affected. • There is a huge problem in education in the USA whereby in many cases, schools in more affluent areas gain more funding than schools in poorer areas. This is sometimes called a “Funding Gap”. • This means that young people from poorer areas do not get as good an education, and this affects black and Hispanic families the most. • Most educational funding comes from state and local governments with only 10% of funding coming from the federal government. • A 2004 report found that there were funding gaps in 36 of the 50 states. • This means that most states spend thousands of dollars more on pupils in richer areas compared to poorer areas.
Education • Teachers in the USA are paid based on their qualifications, years experience, extra curricular activities etc. This means that the best qualified and most experienced teachers are paid more. • Since the best teachers are paid more, schools with less funding cannot afford to employ them, and this in part explains the inequalities in the US education system.
Education • In 2010 in terms of graduating from high school or achieving a Bachelor’s degree: • Hispanics (42%) and Blacks (58%) have the least number of high school graduates. • Whites (81%) have the most high school graduates, with Asians (32%) having the highest percentage of Bachelor degrees.
Graduation Rates High School Graduation Rates 2015 Asian 90% White 88% Hispanic 78% Black 75% College Graduation Rates 2015 Asian 55% White 47% Black 33% Hispanics 23%
Education • Black and Hispanic children are far more likely to attend poor schools. • Children from low-income families are 6 times more likely to drop out of school compared to children from high-income families. • https://www.youtube.com/watch?v=ROCxtuyFjp0
Education • Causes of educational inequality • In an equal world there would be no difference in educational attainment between the different minority ethnic groups. However, statistics show that Whites and Asians consistently outperform Hispanics and Blacks in terms of educational attainment. Why? • Impact of poor neighbourhoods • A significant number of blacks and Hispanics live in poor areas. These areas are characterised by poor housing, unemployment, dysfunctional families, crime and drugs. Children brought up in these areas are less likely to value education or go to school hence educational attainment levels are low.
Education • 2. ‘Poor Schools’ attended by many B+H have: • Problems attracting and retaining suitably qualified teachers and so classes go untaught. • A lack resources for equipment such as computers. School buildings may require extensive repairs. Often schools with the best results get the most funding. • More disruptive and disaffected students making it harder for pupils to learn. • Also, many Americans with money send their children to expensive but high attaining private schools. • Don’t stereotype: Within the Hispanic group Cuban Americans, who tend to be wealthier, often do better than Mexican or Puerto Ricans in terms of educational success.
Education • Graduating High School with a diploma is seen as a crucial step in beating the poverty trap. A college degree is now a prerequisite for a well paid job. • Drop out rates for Blacks and Hispanics do tend to be higher. • Hispanics and Education • Many say that they need to support their family. • Limited English skills. • Cannot afford to go to school. • High illiteracy rates.
Education • Asian American educational success • Unlike Blacks and Hispanics, most Asian Americans do well in education. Evidence shows that Asians tend to have higher educational attainment than the White majority, although this hides the fact that some Asian groups do better than others. • For example, Japanese and Korean Americans, where education is valued, families stable and incomes high, do best. These groups can afford to send their children to the best schools where they often excel (Asians make up 5% of US population but 10% of undergraduates.) • On the other hand, many Vietnamese and Cambodians, who are on average poorer than other Asian American groups, do very poorly in terms of education.
Education • Black and Hispanic children are far more likely to attend poor schools. • Children from low-income families are 6 times more likely to drop out of school compared to children from high-income families.
Health • The system of health care in the US is very different from the UK. • In the USA national health care provision is very limited. • There are some programmes which provide limited healthcare to older people and poorer people. • However, most Americans are expected to pay for their own health care through private medical insurance.
Health Inequalities • Income and health inequalities • Figures from 2016 show that the wealthiest 1% of Americans live 10 to 15 years longer than the poorest 1%. • People on low incomes are less likely to be able to afford good quality healthcare in the USA as this has to be paid for through your own money or insurance. • Of the 30 million people who do not have health insurance in the USA, 8 out of ten are considered to have low incomes. • Americans living in poverty are twice as likely to suffer from depression compared to those not in poverty. This is often caused by the stress of poverty - living in high crime areas, lack of secure housing, worrying about bills etc.
Health Inequalities • Race and health inequalities • Income inequality is closely linked with racial inequality in acting as a determinant (cause) of health inequalities. • There is a great deal of evidence highlighting how blacks suffer poorer health outcomes than other groups. The main reason for this is the fact that they are the poorest ethnic group in the USA. • Black men over 45 have a 70% higher risk of suffering from heart failure compared to white men. • Blacks under 50 years old are twice as likely to die from diabetes or strokes compared to the whites.
Health Inequalities • Race and health inequalities • The prevalence of these diseases has been directly linked to lifestyle factors typically found in poorer communities such as poor diet and high alcohol intake. • The stress of living in poverty means people are more likely to turn to these unhealthy activities as a form of comfort and release.
Video Clip • https://unnaturalcauses.org/video_clips_detail.php?res_id=213
Health • Most Americans (58%) receive their private health insurance through their employer. Companies like BlueCross BlueShield are among the leading private health care providers. • US Government health programmes cover around 28% of the population and include: • Medicare – Mostly for people over 65 years of age and administered by Federal Government. • Medicaid – Covers people on low incomes including children, pregnant women and the disabled. Administered by States. • According to the United States Census Bureau, in 2012 there were 48.0 million people in the US (15.4% of the population) who were without health insurance.
Problems with the US health care system (pre-2010) • The US health care system works well for those with full- coverage private medical insurance. Facilities and treatment can be world class, public satisfaction rates are high and waiting times are virtually non-existent. However… • The USA spends the most money on health care in the world ($2.26 trillion; 15.2% GDP) but outcomes (life expectancy, infant mortality, etc.) are poorer than many other developed countries. • There is a great deal of duplication/inefficiency in the US health care system as companies compete for business. Also, bureaucracy (paper work) costs are high. • The system is hugely unfair. Around 1.5 million Americans lose their homes every year due to unaffordable medical costs.
Health • Impact of US health care system on minority groups • As Blacks and Hispanics are more likely to have lower incomes or to be unemployed, they are, as a result, less likely to have private medical insurance. They are also more likely to depend on Medicaid or be uninsured. • 50% of Blacks and 42% of Hispanics have private health insurance compared to 74% of Whites. • 21% of Blacks and 32% of Hispanics were uninsured compared to only 13% of Whites and 14% of Asians.
Health • Overall Health • Ethnic minorities suffer worse health compared to whites. Black women have the highest death rates from heart disease, lung cancer and strokes. Hispanics are more likely to be employed in high-risk occupations. • Infant mortality is twice as high for Black infants as it is for white infants.
Health • Selected health statistics by ethnic group • Life expectancy (years) 2010 • Whites Blacks Hispanics AsiansNative Amer. • 78.9 74.6 82.8 86.5 76.9 • Infant mortality rates (per 1,000 births) 2009 • Whites Blacks Hispanics Asians Native Amer. • 5.76 13.63 6.01 4.89 8.06 • In basic terms, infant mortality rates for black and Hispanic Americans are higher than for white Americans which suggests that whites (and Asians) have better health.
Hispanic mortality paradox • If Hispanic Americans are more disadvantaged and experience health inequality – why do they live longer than whites? The short answer is we don’t know! • Hispanic culture may have some protective effect. Tight-knit families and immigrant communities offer crucial support to people battling illnesses. • Hispanics, especially recent immigrants, also tend to behave in more healthy ways, smoking and drinking less. • However, some suggest that the Hispanic mortality paradox is mostly a result of migration and miscounting. • Others say that immigrants are in better physical condition, - the “healthy migrant” hypothesis. • Others argue that sick Hispanic immigrants tend to return to their home countries, so they don’t show up in the statistics. This is the “salmon bias” hypothesis.
Health Inequalities • Signs of improvement: • The Affordable Care Act (ACA) (Obamacare) • In an attempt to reduce the impact of inequality on health care provision President Obama introduced the ACA. This came into force in 2014 and became knows as Obamacare. • The Act set out to increase the number of people covered by the government funded health care programmes Medicaid (under 65s) and Medicare (over 65s) and improve the quality and range of care provided. • The act also set out to increase the number of people covered by private insurance schemes by making more employers provide cover for staff and allowing greater access to people with pre-existing conditions who were unable to get insurance – e.g. if you had heart trouble in the past you may not be covered for a heart attack.