Download
1 / 1
10 likes | 140 Views
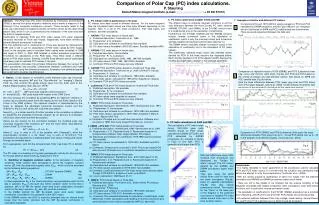
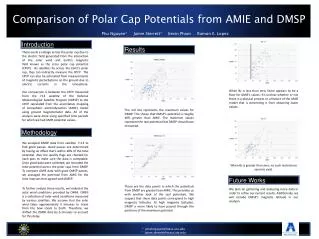
Comparison of Polar Cap Potentials from AMIE and DMSP. Phu Nguyen* Jaime Sterrett* Kevin Pham Ramon E. Lopez. Introduction. Results.

E N D
Comparison of Polar Cap Potentials from AMIE and DMSP Phu Nguyen* Jaime Sterrett* Kevin Pham Ramon E. Lopez Introduction Results There exists a voltage across the polar cap due to the electric field generated from the interaction of the solar wind and Earth’s magnetic field known as the cross polar cap potential (CPCP). As satellites fly across the Earth’s polar cap, they can indirectly measure the CPCP. The CPCP can also be estimated from measurements of magnetic perturbations on the ground due to electric currents in the ionosphere. Our comparison is between the CPCP measured from the F13 satellite of the Defense Meteorological Satellite Program (DMSP) to the CPCP calculated from the assimilative mapping of ionospheric electrodynamics (AMIE) model using ground magnetometer data. All of the analysis were done using specified time periods for which we had AMIE potential values. When Bz is less than zero, there appears to be a floor for AMIE’s values. It’s unclear whether or not there is a physical process or a feature of the AMIE model that is preventing it from obtaining lower values. The red line represents the maximum values for DMSP. This shows that DMSP’s potential is roughly 40% greater than AMIE. The maximum values represent the real potential that DMSP should have measured. Methodology We analyzed DMSP data from satellite F-13 to find good passes. Good passes are determined by having an offset that’s within 20% of the total potential. Also the quality flags are checked for each pass to make sure the data is acceptable. Once good data were collected, we recorded the total potential across the polar caps from DMSP. To compare AMIE data with good DMSP passes, we averaged the potential from AMIE for the time intervals that agreed with DMSP. To further analyze these results, we looked at the solar wind conditions provided by OMNI. OMNI is a collection of solar wind conditions measured by various satellites. We assume that the solar wind takes approximately 5 minutes to travel from the bow shock to Earth. Therefore, we shifted the OMNI data by 5 minutes to account for this delay. When Bz is greater than zero, no such restrictions seem to exist. Future Works These are the data points in which the potentials from DMSP are greater than AMIE. This provides us with another look of the real potentials. We suspect that these data points correspond to high magnetic latitudes. At high magnetic latitudes, DMSP is more likely to have passed through the positions of the maximum potential. We plan on gathering and analyzing more data in order to refine our current results. Additionally, we will include DMSP’s magnetic latitude in our analysis. * phuhnguyen@mavs.uta.edu * Jaime.sterrett@mavs.uta.edu