Download

1 / 55
550 likes | 708 Views
A SUITE OF WEB TOOLS FOR MORPHOMETRIC, GENETIC, AND MICROARRAY ANALYSIS OF THE MOUSE CNS. Glenn Rosen, Melburn Park, Robert Williams, Jonathan Nissanov, and Ken Manly. Informatics Center for Mouse Neurogenetics. The Mouse Brain Library - Rosen iScope -Williams, Park

E N D
A SUITE OF WEB TOOLS FOR MORPHOMETRIC, GENETIC, AND MICROARRAY ANALYSIS OF THE MOUSE CNS Glenn Rosen, Melburn Park, Robert Williams, Jonathan Nissanov, and Ken Manly
Informatics Center for Mouse Neurogenetics • The Mouse Brain Library - Rosen • iScope -Williams, Park • Neurocartographer - Nissanov • Neurogenetics Tool Box - Manly
Goal of Project • Provide online resource for complete mapping of differences in brain structure to defined sets of genes (quantitative train loci; QTLs) • Large scale (e.g., brain weight, volume) • Small scale (e.g., neuron number)
Specfic Implementation • Universal Access to Neuroanatomic Phenotypes • Digital Dissection • Comprehensive Genotype Data and Tools for Complex Trait Analysis
Universal Access to Neuroanatomic Phenotypes • The Mouse Brain Library • Digital images (0.1–25 µm/pixel) from inbred, RI, and advanced intercross mice. • Ideal for stereologic analysis. • iScope • High-power, through-focus movies. • Microscope controlled over the internet. • Ability to perform neuronal counts on selected regions of selected sections.
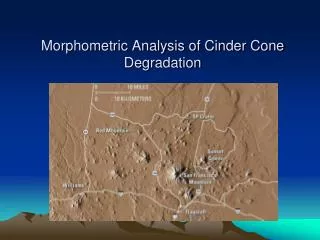
Digital Dissection • Neurocartographer • Generate 3D atlas of mouse brain. • Use 3D atlas to automatically segment regions of brain.
Comprehensive Genotype Data • Databases • RI genotypes and phenotypes • Advanced intercross progeny (G10) • Microarray data from inbred and RI strains • Neurogenetic Tool Box • QTLs without tissue or DNA (WebQTL) • Statistically evaluate neuroanatomic and microarray data with these DBs
Gene Discovery by QTL Mapping • Quantitative Trait Loci • Many medically interesting traits are complex traits • Complex = multiple genes and non-genetic factors • Genes which control complex traits are QTLs • QTLs are detected by statistical associations • Trait values marker locus genotypes (or estimated genotypes between markers) • Potential QTL indicated by LOD score maximum • Significance measured by LOD score value
Evaluate association for many markers and locations between markers significance map location QTL Mapping Principles Marker genotype Trait 1218131017111920... ABAABABB... Progeny individuals
QTL Mapping Goals • Significance • Which LOD score maxima correspond to statistically significant QTLs? • Location • How precisely does the LOD score maximum define the QTL location? • Architecture • How many QTLs and what interactions determine a particular trait?
LRS statistics from 1000 regressions with permuted data P = 0.05 Permutation Test for Significance Marker genotype Trait 1218131017111920... ABAABABB...
.. 200 repetitions. Bootstrap for Location Marker genotype Trait 1218131017111920... ABAABABB...
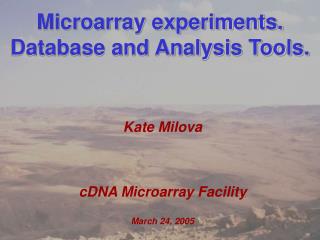
e l c i r t n e V t n e c r e P 4 8 7 4 8 6 7 5 5 6 4 3 0 2 2 2 1 3 1 4 5 0 2 6 1 4 J J 1 1 1 1 1 2 1 1 1 1 2 2 1 2 2 / B A A A B B B A A B B 6 A / A B A A B B B A A A A A B A B X X X X X X X X X X X L X X X X X X X X X X X X X X X A B B B A A A B B A A B B A B B A A A B B B B B A B A 7 5 C Distribution of Ventricle Size 4 3 2 1 0 Strain
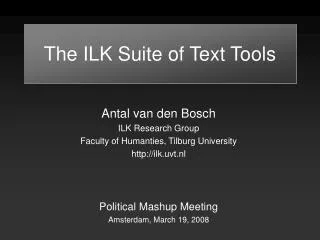
20 15 10 5 0 1 2 3 4 5 6 7 8 9 10 11 12 13 14 15 16 17 18 19 X Mapping Ventricle Size LRS Score Chromosome
Two Goals for the Online Microscope • Web publication of hard slide libraries • MBL • Pathfinding for other collections • Automatic production of soft libraries
Java Interface • Navigation controls • High and low power index views • Quicktime screen
Navigation Panes • Blue crosshairs show current location • Moveable red dot selects desired location
Co-development: Focussing Problem • Automatic focussing via proprietary noise-analysis algorithm • Interaction with vendor to obtain custom chip giving us software access to noise value • Focussing can be taken on- of off-board
Robotic Slide Library • Commercial design • Smartmotor™ technology • Pneumatic actuators • Changeable cassettes • 6x82 2x3 inch slides
T T T T T
Atlas Availability • www.neuroterrain.org • www.nervenet.org
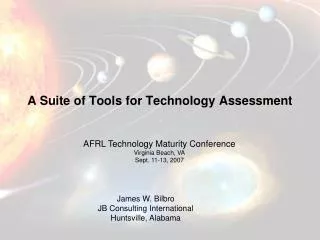
Blockface Images Section Images Section Images Alignment Parameters Error Detection 2D-2D Rigid- body Alignment Acceptable? Resample Y N Median Filter Reinitiali- zation Reconstruction AIR AIR
2.5D 3D Ordered Unaligned 2D Manual Auto Z-Axis matching 3D Reconstruction Matching Plane Pairs Manual Auto XY Plane matching Matching 3D Features Matching Inplane Features Aligned Sections Warping
Case 1: test Warping reference Case 2: test
Results Case 1 Case 2
WebQTL Mapping Service • http://webqtl.roswellpark.org/ • Mapping populations • Recombinant inbred lines • BxD advanced intercross • No genotyping necessary
WebQTL Data Entry • Choice of data entry methods • Choose a data file • Paste or type data
WebQTL Data Confirmation • Data entry or confirmation form
Future Directions • MBL • Extend MBL • Improve DB integration • Interface enhancement • On-line image analysis tools • iScope • Additional design and construction • Robotic slide handling • Web archive of through-focus image stacks • Streaming Video • Neurocartographer • Strengthen and extend segmentation algorithm • Segment MBL • Neurogenetics Tool Box • Batch submission of multiple traits • Search for interacting QTLs • Data archiving and export • Additional crosses and cross designs • DNA Array
Acknowledgments • This project is part of the Human Brain Project/Neuroinformatics program funded jointly by the National Institute of Mental Health, National Institute on Drug Abuse, and the National Science Foundation (P20-MH 62009).