Download
1 / 26
260 likes | 420 Views
Acid-Induced Gene Expression in Helicobacter pylori : Study in Genomic Scale by Microarray. Sunny Ang, Cha-Ze Lee, Komam Peck, Michelle Sindice, Udayakumar Matrubutham, Martin A. Gleeson, and Jin-Town Wang

E N D
Acid-Induced Gene Expression in Helicobacter pylori: Study in Genomic Scale by Microarray Sunny Ang, Cha-Ze Lee, Komam Peck, Michelle Sindice,Udayakumar Matrubutham, Martin A. Gleeson,and Jin-Town Wang Graduate Institute of Microbiology, National Taiwan University College of Medicine, Department ofInternal Medicine, National Taiwan University Hospital, and Institute of Biomedical Science,Academia Sinica, Taipei, Taiwan, and Invitrogen Corporation, Carlsbad, California Infection and Immunity, Mar. 2001, p. 1679-1686
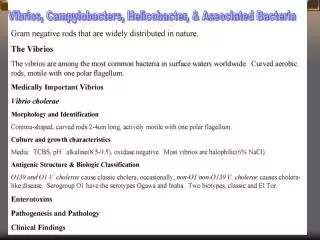
Introduction • Helicobacter pylori • The causative agent of chronic superficial gastritis in humans • The ability to survive under acidic stomach conditions might be one of the virulence mechanisms • Monitoring theresponse of H. pylori genes during acid stress may be helpful to understand the pathogenesis
Introduction • DNA microarray • A system for monitoring of a large number of gene expressions has been developed • Analyze the expression of hundreds of genes in a single hybridization experiment • A catalyzed amplification of reporter deposition (CARD) method was adopted to explore the gene expression of H. pylori
Growth conditions & total RNA isolation • H. pylori NTU-D1, an H. pylori strain from a patient with duodenum ulcer, was used for analysis • The pH value of the medium was titrated by HCl to pH 7.2 and 5.5, respectively • Cells were cultured at pH 7.2 and 5.5 at 37°C in a microaerophilic chamber containing 10% CO2, 5% O2, and 85% N2 for 48 h • Cells were harvested after 48 h on incubation for total RNA extraction
Microarray preparation • PCR products that contained 1534 predicted open reading frames (ORFs)were concentrated by evaporation at 95°C to obtain a concentration of 2 to 3 ug/ul before they were spotted onto a positively charged nylon membrane • Samples were held at the tip of the pins for delivery by the action of surface tension
Microarray preparation • ORFs that were less than 100 nucleotide in size, that were untranslated, or for which more than one copy of the homologous putative ORF was found were excluded from the microarray (56 ORFs) TABLE 1.ORFs which are not included in the H. pylori microarray membrane
cDNA probe preparation 10 ug of total RNA(from two culture conditions) Add 12 uM random primers 1 mM dATP, dCTP, dGTP,0.8 um dTTP, biotin-16-dUTP 400 U reverse transcriptase &Incubated at 42°C for 90 min Add NaOH for degrade RNA Biotin-labeled cDNA
Colorimetric detection & data analysis The hybridization with cDNA probe & membranewas performed at 63°C for up to 14 h Blocking & washing Add β-galactosidase-conjugated streptavidin Add X-Gal substrate The chromogens generation The membrane was scanned by a PowerLook 3000 scanner& Densitometrywas performed with imaging software
Catalyzed amplification of reporter deposition (CARD) method • Microarray preparation:1534 ORFswere spotted onto a positively charged nylon membrane • cDNA probe preparation:Isolation of total RNA, and biotin-16-dUTP labeling of the cDNA probe • Hybridization:cDNA probe mixture with the membrane • Washing:Eliminating non-hybridized and non specific binding probes
Catalyzed amplification of reporter deposition (CARD) method • Colorimetric detection:Obtaining fluorescent image of each spot • Data analysis:to identify genes of H. Pylori that were expressed in responses to acid stress, array hybridization signals were compared between RNA from pH 7.2 and 5.5 conditions after standardization with internal rRNA controls
Total RNA expression on a microarray • Fig. 1.Comparison of acidic stress responses by culture at pH 7.2 (A) and pH 5.5 (B)
Genes expression on microarray • 53 ORFs were highly expressed under both growth conditions (defined by a densitometry ratio of ≥30%compared with the 23S rRNAinternal standard)(Table 2) • 445 ORFs which were stably expressed (<30% of rRNA in densitometry)
TABLE 2.22 ORFs that were very highly expressed (ratio > 1.0) & 31 ORFs with densitometry ratios between 0.3 and 1.0
Genes expression on microarray • 80 ORFs that had significantly increased expression levels at pH 5.5 were divided into three proups TABLE 3. Group iORFs that were known corresponded to acid stress
Genes expression on microarray TABLE 3. Group iithose without database match
TABLE 3. Group iiiORFs that were not reported to be related to acid response
Genes expression on microarray • Only 4 ORFs had deceased expression levels during acidic stress TABLE 3. Down-regulated
Comparison of expression levels in slot blotting and microarray • To confirm the expression level in microarray, six ORFs were randomly selected for fluorescence-labeled slot hybridization • HP0632: Ni-Fe hydrogenase • HP0110: cochaperone and heat shock protein • HP1263: homologue of the NADH-ubiquinone oxidoreductase • HP0830: Glu-tRNA amidotransferase A subunit • HP0232: secreted protein involved in motility • HP1037 : hypothetical protein
Slot blot hybridization • 10 ug of total RNA was analyzed on 1% denaturing agarose gel • Then, transfer the total RNAs onto a nylon membrane • Membrane hybridized with digoxigenin (DIG)-labeled antisense RNA FIG. 2. Slot blot hybridization of HP. RNA
Comparison of expression levels bymicroarray at different pHs TABLE 4. Comparison of expression levels by microarray at different pHs • HP1037 was detectable by microarray at pH 7.2 byt not by slot blotting • Semiquantitative RT-PCR assay was done by 10-fold serial dilution of cDNA
Semiquantitative RT-PCR 1 ug of total RNA HP 1031 antisense primer Reversetranscription cDNA 10-fold dilution pH 7.2 pH 5.5
Semiquantitative RT-PCR • Estimated by this assay, there were 5 X 10⁹ copies of HP1037 mRNA at pH 7.2 and there were 1011 copies of HP1037 mRNA at pH 5.5 • Therefore, the sensitivity of the CARD method should less than 5 X 10⁹ copies
Detection limit of this microarray method • To determine the sensitivity of the CARD method, 23S rRNA was transctibed in vitro and then biotin-labeled cDNA probe was obtained through RT • The limit of the CARD method was determined to be 50 pg, which corresponds to approximately 108 copies of 23S rRNA
Summary • There are 498 ORFs stably expressed under both pH conditions without significant variation. • 80 ORFs whose expression levels significantly increase under acidic conditions, and 4 ORFs that are suppressed by acidic conditions. • The detection limit of the CARD method reached approximately 108 copies in each hybridization experiments. • This method can be used for genomic-scale detection of prokaryotic gene expressions
Thanks for your attention Speaker: 王信元 Advisor: Haimei Huang Date: 2002/11/12