Download
1 / 21
210 likes | 397 Views
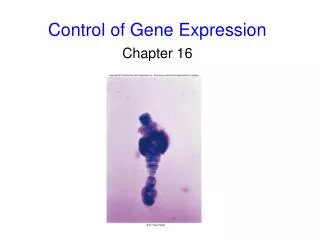
Exploring the Metabolic and Genetic Control of Gene Expression on a Genomic Scale. DeRisi, Iyer, and Brown (1997) Science 278 , 680-686. Introduction to Yeast. Free-living fungus; generally single-celled Eukaryotic; possesses a nucleus and other intracellular organelles

E N D
Exploring the Metabolic and Genetic Control of Gene Expression on a Genomic Scale DeRisi, Iyer, and Brown (1997) Science278, 680-686
Introduction to Yeast • Free-living fungus; generally single-celled • Eukaryotic; possesses a nucleus and other intracellular organelles • Grows by budding; size of bud reflects progression through the cell cycle • Can exist either as a haploid (1N) or diploid (2N); haploids can be mated to form new diploids; diploids can be sporulated to make new haploids • First eukaryotic genome to be completely sequenced (1996)
Yeast Genetic Nomenclature • All named genes have a three-letter abbreviation followed by a number • Wild type genes are denoted as italicized capital letters (i.e. ACT1) • Mutant alleles (which are usually recessive) are denoted by small-case letters, followed by an allele number (i.e. ura3-52); dominant alleles are denoted by capital letters • Frank deletions are usually followed by the D symbol (i.e. his3D)
More Yeast Genetic Nomenclature • Not all genes in the genome have been named • Such loci are therefore referred to by their chromosome location • The first space is always a Y • The second space is a letter referring to the chromosome number (A = chromosome I, B = II, etc.) • The third space is either R or L, and refers to whether the locus is to the Right or Left of the centromere as the chromosome is conventionally drawn (long arm is Left arm) • A three digit number follows; this is the locus number on that arm • The last space is either a W or a C; referring to either the Watson or Crick strand (top or bottom respectively as conventionally drawn)
Questions 1. Have all the genes required for a particular process (in this case, global carbon utilization pathways) been identified? 2. How do such genes change in expression over time? 3. Are the genes involved in a particular process coordinately regulated?
DeRisi, Iyer, and Brown Experiment: Diauxic shift • Metabolism of glucose v. ethanol • Inoculate culture; soon thereafter isolate cells and make RNA, from this create cDNA labeled with Cy3-dUTP • At ~9h post-inoculation and every 2h thereafter, isolate cells and make RNA, from these create cDNA labeled with Cy5-dUTP
Diauxic Shift: Experiment Parameters Figure 5
One microarray, this one compares the first two time points, after initial inoculation (green), then 9.5 h later (red) Figure 1
Results: As time proceeds, more and more differences are observed By the last time point: 710 genes induced at least 2x (183 genes at least 4x) 1030 genes repressed at least 2x (203 genes at least 4x) >870 of these previously unknown to be associated with this process Figure 2: Repeated views of box outlined in Figure 1a
Changes in metabolism as diauxic shift proceeds; red genes are the ones turned on; green ones are the ones turned off Figure 3
Group behavior: Genes that work coordinately are regulated coordinately Figure 4
Genes whose expression increases markedly, but only in the last time point; most have a glucose-repressible carbon source response element (CSRE) in their promoters Figure 5
Ribosomal protein genes, all decline b/c of loss of Rap1 mRNA. Rap1 encodes a transcription factor required for synthesis of these genes Figure 5
Other uses of microarrays explored here • Determine effects of loss of a common transcription factor • TUP1 encodes a transcriptional co-repressor that works with Mig1p • Compare TUP1 cells to tup1D cells • TUP1 cDNA = green; tup1D cDNA = red; • red spots therefore genes suppressed by Tup1p
Many (10%) of the same genes induced by diauxic shift are also induced by the absence of Tup1p; suggesting Tup1p is important for diauxic shift Figure 2 (bottom center panel)
Logic of the Yeast Metabolic Cycle: Temporal Compartmentalization of Cellular Processes Tu et al., (2005) Science 310, 1152
Oxygen consumption varies in a periodic manner: What genes are expressed in a periodic manner? Figure 1
Mitochondrial large ribosomal subunit protein Fatty acyl CoA oxidase Adenine deaminase Figure 2
Expression of Genes Note that energy and metabolism protein genes are more likely to be periodic than others Table 1
Genes can be arranged in superclusters Figure 3D