Download
1 / 13
130 likes | 152 Views
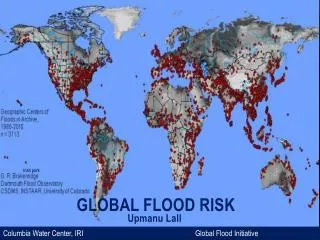
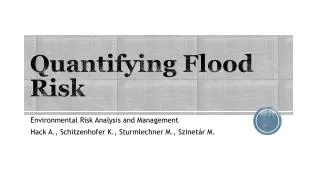
This program aims to address gaps in flood hazard data, increase public awareness, support mitigation planning, and provide enhanced digital tools for better risk management. By aligning risk analysis programs and tools, communities can quantify and reduce flood risk effectively.

E N D
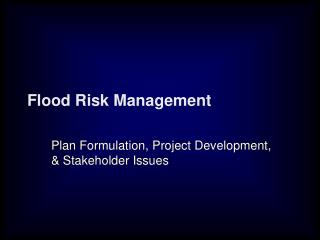
Examples in Quantifying Flood Risk Doug Bellomo July 13, 2009 National Flood Risk Management Summit
Risk MAP (Mapping, Assessment, Planning) Vision Through collaboration with State, Local, and Tribal entities, Risk MAP will deliver quality data that increases public awareness andleads to action that reduces risk to life and property.
Flood Hazard Data • Goal 1: Address gaps in flood hazard data to form a solid foundation for risk assessment, floodplain management and actuarial soundness of the National Flood Insurance Program. Flood Study Determination by Type
Public Awareness/Outreach • Goal 2: Ensure that ameasurableincrease of thepublic’s awareness and understanding of risk resultsin ameasurable reduction of current and future vulnerability.
Hazard Mitigation Planning • Goal 3: Lead and support States, local, and Tribal communities to effectivelyengage in risk-based mitigation planning resulting insustainable actions thatreduce or eliminate risks to life and property from natural hazards.
Enhanced Digital Platform • Goal 4: Provide anenhanced digital platform that improves management of Risk MAP, stewards information produced by Risk MAP,and improves communication and sharing of risk dataand related products toall levels of government and the public.
Alignment and Synergies • Goal 5: Align Risk Analysis programs and develop synergies to enhance decision making capabilities through effective risk communication and management.
Risk MAP Tools • Risk MAP tools to quantify risk may include: • Base digital dataset • Nationwide risk assessment • Multiple frequency flood data • Flood depth grids Risk-Based Solutions Tailored to Unique Community Requirements
Communities and Risk • Communities must use the tools and data to: • Better Quantify Risk • Plan Their Future • Execute • “Cities routinely build in the flood plain…That's not an act of God; that's an act of City Council.” • Source: Washingtonpost.com, 6/19/09
Quantify and Track No Plan/NFIP Minimums Plan/Higher Standards Flood Risk Time
Quantifying Reduced Risk Flood Hazard