Download
1 / 11
110 likes | 230 Views
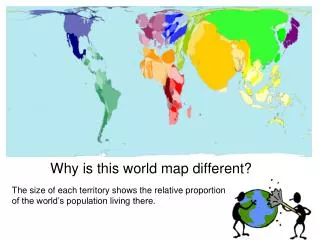
This lesson explores the unique map of the world, highlighting how the size of territories reflects the relative population living in each region. Students will engage in activities to match populations to specific countries and areas, such as India, the UK, and Greenland. Learning objectives include grasping key geographical vocabulary related to population, providing examples of sparsely and densely populated areas, and explaining the reasons behind these population patterns. By the end, pupils will be able to calculate and visualize population density across different regions.

E N D
Why is this world map different? The size of each territory shows the relative proportion of the world’s population living there.
Match the population to the country or area! Greenland India London Scotland UK England 6 million 5 million 1 billion 55 000 49 million 60 million
Answers in rank order (high to low). India 1 billion UK 60 million England 49 million London 6 million Scotland 5 million Greenland 55 000
Learning Objectives By the end of this lesson pupils: • Must be able to understand key geographical vocabulary to explain population. • Should be able to give examples of sparsely and densely populated regions. • Could be able to explain why regions are sparsely or densely populated. www.GeogTeacher.com
Key Terms Population – The people who live in an area Population distribution – The way in which people are spread out in an area. Population density – The number of people living in an area (usually per square kilometre). www.GeogTeacher.com
Copy and complete the above table calculating the population density by dividing the population by the area.
Densely populated Lots of people per Km². Sparsely populated Few people per Km². Sparse and densely populated areas. 2 per Km² 11 per Km²
World population density and distribution • Use an atlas/your planner to label 5 densely populated • areas in one colour and 5 sparsely populated areas in another colour. • 2. Add a key to your map