Optimization of Total Distribution Cost in Supply Chain Management
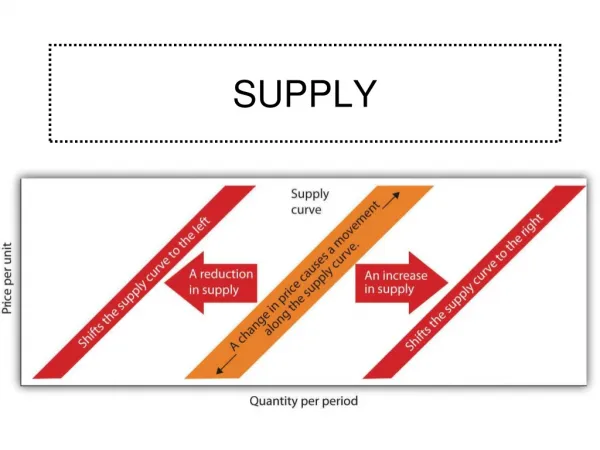
This analysis explores the calculation of total distribution costs across various supply and demand centers. It focuses on the transportation costs associated with different ports and the distribution of goods from multiple supply hubs to specific demand locations. By examining various parameters like supply capacities and associated costs, this assessment aims to identify inefficiencies and optimize the overall distribution system. The overall goal is to balance supply with demand while minimizing costs.

Optimization of Total Distribution Cost in Supply Chain Management
E N D
Presentation Transcript
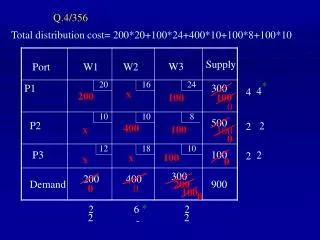
Q.4/356 Total distribution cost= 200*20+100*24+400*10+100*8+100*10 Supply W3 Port W1 W2 20 16 24 * 300 4 4 x 200 100 100 0 10 10 8 500 P2 2 2 400 x 100 100 0 12 18 10 P3 100 2 2 x 100 x 0 300 200 400 Demand 900 200 0 0 100 0 * 2 6 2 2 2 -
Q.5/357 Total distribution cost= 400*10+200*15+100*15+200*18 Port Clermont Hamilton Butler Supply * 10 20 15 * 5 5 500 400 x 100 100 0 12 18 15 Northwest Gas 3 3 400 200 200 200 x 0 300 900 400 200 Demand 0 0 200 0 2 5 3 5 - 3
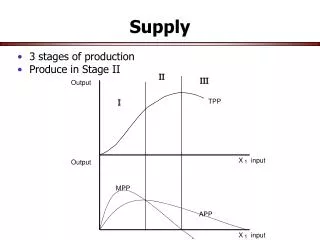
Capacity: 130 70 100 • Supply centers: • St.Louis • Richmond • Chicago Total supply=300 tons • Demand Centers: • Atlanta • Denver • Los Angeles Demand: 80 110 60 Total demand= 250 tons There is an excess capacity of 50 tons
Total distribution cost= 20*9+60*7+50*0+70*3+80*4+20*8 Los Angeles Dummy Supply Port Atlanta Denver 6 9 7 0 * 6 130 1 1 2 50 60 x 20 80 20 0 12 3 5 0 70 x - - Richmond 2 3 70 x x 0 4 8 11 0 * x 100 4 3 Chicago 4 80 20 x 4 20 0 110 60 80 50 300 Demand 40 0 0 0 20 0 5 2 0 2 * 2 2 - 5 2 1 4 - - * - 1 4