Download
1 / 10
100 likes | 122 Views
This review examines the impact of a tax on consumers and firms, quantifies the burden borne by them, and explores consumer and producer surplus.

E N D
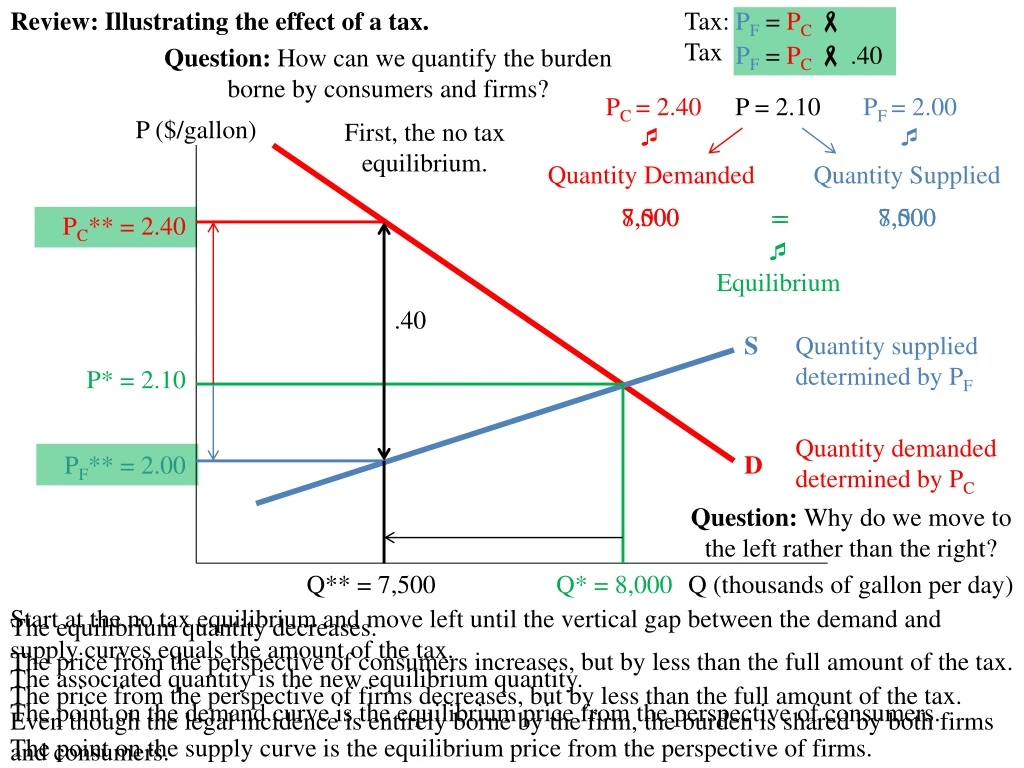
Review: Illustrating the effect of a tax. Tax: PF = PC Tax PF= PC .40 Question: How can we quantify the burden borne by consumers and firms? PC = 2.40PF = 2.00 P = 2.10 P ($/gallon) First, the no tax equilibrium. Quantity DemandedQuantity Supplied 8,000=8,000 7,500= 7,500 PC** = 2.40 Equilibrium .40 S Quantity supplied determined by PF P* = 2.10 Quantity demanded determined by PC PF** = 2.00 D Question: Why do we move to the left rather than the right? Q** = 7,500 Q* = 8,000 Q (thousands of gallon per day) Start at the no tax equilibrium and move left until the vertical gap between the demand and supply curves equals the amount of the tax. The equilibrium quantity decreases. The price from the perspective of consumers increases, but by less than the full amount of the tax. The associated quantity is the new equilibrium quantity. The price from the perspective of firms decreases, but by less than the full amount of the tax. The point on the demand curve is the equilibrium price from the perspective of consumers. Even though the legal incidence is entirely borne by the firm, the burden is shared by both firms and consumers. The point on the supply curve is the equilibrium price from the perspective of firms.
Consumer Surplus and Producer Surplus P Market Demand Curve for Tutors How many students would hire a tutor if the tutor’s “price” was ______, given that …? 300 Greatest Amount a StudentStudent Would Pay 300 280 175 25 75 180 225 230 275 100 1 4 5 2 0 6 3 250 200 275 Andy 225 Kate 150 175 Dan 100 100 Liz Question: By how much does each student value the benefits of tutoring services? 75 Meg 50 25 Ned D Q 1 2 3 4 5 6 Revealed Preference When the price of a good is $xxx and an individual, call him Joe, does purchase the good does not purchase the good Joe’s actions reveal his preferences. Joe values the benefits of the good by at least $xxx Joe values the benefits of the good by less than $xxx Value Joe places on the benefits $xxx Value Joe places on the benefits <$xxx
Value of Benefits Greatest Amount Studenta Student Would Pay Question: By how much does each student value the benefits of tutoring services? Claim: Andy 275 The value a student places on the benefits of tutoring services Greatest amount the student would pay for tutoring services Kate 225 equals Dan 175 Liz 125 Meg 75 Question: Why do the values differ from student to student? Ned 25 Question: By how much does Andy value the benefits of tutoring services? If the price of tutoring services $275 If the price of tutoring services were $276 Andy would purchase tutoring services. Andy would not purchase tutoring services. Value Andy places on the benefits $275 Value Andy places on the benefits < $276 Value Andy places on the benefits of tutoring services = $275.
Consumer Surplus The value a student places on the benefits of tutoring services Greatest amount the student would pay for tutoring services equals Value of Net Benefit of Receiving Tutoring Services StudentTutoring BenefitsIf price = $250If price = $150If price = $50 Andy 275 $25 $125 $225 Kate 225 - 75 175 Dan 175 - 25 125 Liz 125 - - 50 Meg 75 - - 25 Ned 25 - - - Consumer Surplus $25 $225 $600 Consumer Surplus: Net benefit buyers enjoy from purchasing and consuming the good.
Greatest Amount a Student Would Pay Net Benefit of Receiving Tutoring Services StudentValue of BenefitsIf price = $250If price = $150If price = $50 Andy 275 $25 $125 $225 Kate 225 - 75 175 Dan 175 - 25 125 Liz 125 - - 50 Meg 75 - - 25 Ned 25 - - - P Consumer Surplus $25 $225 $600 300 Consumer Surplus: Net benefit buyers enjoy from purchasing and consuming the good. 250 Height of Market Demand Curve: Reflects the benefit a buyer enjoys from consuming a specific unit of the good. 200 150 Consumer Surplus: The benefit each buyer enjoys from consuming the good less what each buyer must pay for the good. 100 Area Beneath the Market Demand Curve Lying Above the Price: Reflects all the net benefits buyers enjoy, the consumer surplus, from purchasing and consuming the good. 50 D Q 1 2 3 4 5 6
Market Supply Curve for Tutors How many majors would agree to be a tutor if the tutor’s “price” was ______, given that …? P Least Amount Required to Induce a Major Studentto Be a Tutor 5 3 2 1 0 6 4 275 20 25 200 125 225 75 300 S 250 Kim 275 John 225 200 Adam 200 150 Lisa 125 Walt 75 Question: What is each major’s opportunity cost of providing tutoring services? 100 Beth 25 50 Q 1 2 3 4 5 6 Revealed Preference When the price of a good is $xxx and an individual, Joe, does purchase the good does not purchase the good Joe values the benefits of the good by at least $xxx Joe values the benefits of the good by less than $xxx Value Joe places on the benefits $xxx Value Joe places on the benefits <$xxx
Opportunity Cost Question: What is each major’s opportunity cost of providing tutoring services? Least Required to Induce a Major to Provide StudentTutoring Services Claim: The value of a major’s opportunity cost of providing tutoring services The least amount required to induce a major to provide tutoring services Kim 275 equals John 225 Ralph 200 Lisa 125 If the price of tutoring services were $24 If the price of tutoring services were $25 Walt 75 Beth 25 Beth would not provide tutoring services. Beth would provide tutoring services. Question: What is Beth’s opportunity cost of providing tutoring services? Beth would pursue the “other activity.” Beth would not pursue the “other activity.” Opportunity cost represents whatever is foregone when an activity is pursued. Value Beth places on the “other activity” > $24 Value Beth places on the “other activity” $25 Beth’s opportunity cost of providing tutoring services equalsthe value she places on the benefits she receives from the “other activity.” Value Beth places on the “other activity” = $25. Beth’s opportunity cost of providing tutoring services = $25. Question: Why do the opportunity costs of the majors differ?
Producer Surplus The value of a major’s opportunity cost of providing tutoring services The least required to induce a major to provide tutoring services equals Least Required to Induce a Major to Provide Tutoring Services Net Benefit of Providing Tutoring Services StudentOpportunity CostIf price = $50If price = $150If price = $250 Kim 275 - - - John 225 - - 25 Ralph 200 - - 50 Lisa 125 - 25 125 Walt 75 - 75 175 Beth 25 25 125 225 Producer Surplus 25 225 600 Producer Surplus: Net benefit sellers enjoy from production and sale the good.
Opportunity Cost of Providing Net Benefit of Providing Tutoring Services StudentTutoring Services If price = $50If price = $150If price = $250 Kim 275 - - - John 225 - - 25 Ralph 200 - - 50 Lisa 125 - 25 125 Walt 75 - 75 175 Beth 25 25 125 225 Producer Surplus 25 225 600 P S 300 Producer Surplus: The net benefit sellers enjoy from producing and selling the good. 250 Height of Market Supply Curve: The seller’s opportunity cost of providing a specific unit of the good. 200 150 Producer Surplus: What each seller receives from the sale of the good less the opportunity cost each seller incurs by providing it. 100 Area Above the Market Supply Curve Lying Beneath the Price: Reflects all the net benefit sellers enjoy, the producer surplus, from producing and selling the good. 50 Q 1 2 3 4 5 6
Summary: Consumer and Producer Surplus Consumer Surplus: The net benefit buyers enjoy from purchasing and consuming the good. Height of Market Demand Curve: Reflects the benefit a buyer enjoys from consuming a specific unit of the good. Consumer Surplus: The net benefit buyers enjoy from purchasing and consuming the good; the benefit each buyer enjoys from consuming the good less what each buyer must pay. Area Beneath the Demand Curve Lying Above the Price: Reflects all the net benefits buyers enjoy, the consumer surplus, from purchasing and consuming the good. Producer Surplus: The net benefit sellers enjoy from producing and selling the good Height of Market Supply Curve: The seller’s opportunity cost of providing a specific unit of the good. Producer Surplus: The net benefit sellers enjoy from producing and selling the good; what each seller receives from the sale of the good less the opportunity cost each seller incurs by providing it. Area above the Supply Curve Lying beneath the Price: Reflects all the net benefit sellers enjoy, the producer surplus, from producing and selling the good.


