Download
1 / 32
330 likes | 519 Views
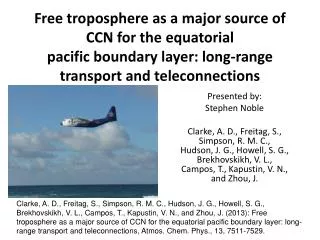
Free troposphere as a major source of CCN for the equatorial pacific boundary layer: long-range transport and teleconnections. Presented by: Stephen Noble Clarke, A. D., Freitag, S., Simpson, R. M. C., Hudson, J. G., Howell, S. G., Brekhovskikh, V. L., Campos, T., Kapustin, V. N., and Zhou, J.

E N D
Free troposphere as a major source of CCN for the equatorialpacific boundary layer: long-range transport and teleconnections Presented by: Stephen Noble Clarke, A. D., Freitag, S., Simpson, R. M. C., Hudson, J. G., Howell, S. G., Brekhovskikh, V. L., Campos, T., Kapustin, V. N., and Zhou, J. Clarke, A. D., Freitag, S., Simpson, R. M. C., Hudson, J. G., Howell, S. G., Brekhovskikh, V. L., Campos, T., Kapustin, V. N., and Zhou, J. (2013): Free troposphere as a major source of CCN for the equatorial pacific boundary layer: long-range transport and teleconnections, Atmos. Chem. Phys., 13, 7511-7529.
Outline Project background Explanations CO (carbon monoxide) Volatility Hoppel minimum Clean and polluted case descriptions Aqueous oxidation and convective outflow Combustion and long range transport Project study: sources for boundary layer aerosols Sea salt Growth Mixing Conclusions Criticisms
Background • CLAW hypothesis (Charlson et al. 1987) • Pacific Atmospheric Sulfur Experiment (PASE) August-September 2007 • Remote (Kiribati) • DMS (dimethyl sulfide) nucleation of sulfate aerosol
Failure Figure 1a&b, Hudson and Noble 2009, cloud droplets with CCN at 1% supersaturation • More CCN than in a less remote location in the Caribbean • Woodhouse et al. 2010 and 2013 – More DMS does not lead to formation of many new particles • Condenses on pre-existing particles • Processed in cloud by aqueous oxidation
Definitions • CN = condensation nuclei (aerosols>0.01µm) • CNhot = CN concentrations heated to 360°C • CNcold = CN not heated • CNvol = difference of CNcold and CNhot • CCN.2 = CCN concentration at 0.2% S • DMA = differential mobility analyzer • ITCZ = Intertropical convergence zone
Aerosol instruments • Two CN counters (TSI 3010), one hot and one cold >0.01µm • Ultra fine CN (TSI 3025A) >0.003µm • Aerodynamic particle sizer (APS-TSI 3321) 0.7-7.0µm • Long DMA (TSI 3081) 0.1-0.5µm • Radial DMA 0.01-0.2µm • Time of flight AMS • DRI CCN spectrometer 0.04-1.5% S
CO concentrations as proxy aerosol Low CO concentrations indicate aged clean air masses High CO concentrations indicate recent combustion process in polluted air masses FT = free troposphere
CO can be separated into high (>63ppbv) and low (<63ppbv) cases in boundary layer (BL), buffer layer (BuL), and free troposphere (FT) (upper and lower) This helps to define which are more likely to have pollution from combustion Histograms of CO measurements
Heating to 360°C vaporizes some aerosol (CNvol) Internally mixed aerosol shrink Not volatile remain such as BC and sea salt, among others (CNhot) Volatility of aerosols polluted clean
CNhot as proxy for CCN@0.2% • Much of the CNhot and CCN.2 fall on the 1:1 line • This allows use of the CNhot data as proxy for times when CCN.2 was not available
The Hoppel minimum • Minimum in the size distribution related to cloud processing of aerosols at 0.2% supersaturation usually corresponding to 80nm size • Chemical processing from aqueous oxidation of gases • Physical processing from scavenging and droplet combination
Low CO (clean), 13 Aug CNhot shows higher concentrations near the surface which follows CO SO2 shows high concentrations at the surface
Clean case, convective outflow, 15 Aug Sea salt dominates in the CNhot in the MBL while CNvol has high concentrations in the outflow
Convective outflow (CNvol) DMS and SO2 decrease in cloud indicating aqueous oxidation CO and O3 mostly constant 15 Aug, clean High concentrations and small sizes near the convective out flow Larger sizes at low altitudes
High CO (polluted), 25 Aug Much higher CO concentrations as well as CNhot concentrations in the FT SO2 concentrations are lower at the surface than for the clean case
High CO (polluted) case, 6 Sept • High CNhot concentrations of in the FT with high CO • Where is the combustion occurring as indicated by high CO?
High CO back trajectories for 6 Sept (polluted) • Higher altitude came from the surface into the ITCZ and then subsided (low CO) • Lower altitude subsided from aloft at higher altitudes (high CO)
High CO originates over the Amazon Basin • Low CO over the Pacific • For 6 Sept trajectories with high CO are over Amazon basin near 8/27
CALIPSO data Smoke Cloud Surface Blocked beam Amazon Basin SW NE NE SW Pacific Amazon Basin
So far… • Back trajectories show CO and aerosol likely originated from combustion in the Amazon basin • During a 10 days the air subsided while being transported to the central Pacific • CNvol are produced locally as shown by the convective outflow and decrease of SO2
Which aerosols make up the CCN.2 in the marine boundary layer?
Sea salt and DMS Profiles similar but just reduced after removal of sea salt Nucleation of DMS doesn’t appear to have much effect
Sea salt Sea salt in the boundary layer increases the CCN@0.2%S Removing CCN@0.04%S (most likely sea salt) leaves concentrations in the BL more similar to those in the FT Sea salt
Stacked distributions Larger sizes dominate the surface area distribution Hoppel minima in both polluted and clean at 80nm Higher concentrations at slightly larger sizes in polluted FT clean polluted
Growth of aerosol Hoppel min. in both cases is evidence of aerosol growth by cloud processing Polluted case has a larger processed mode Sizes in the FT polluted are much closer to the min so grow more readily polluted clean
CO level below inversion near constant but higher above 6.5 hours later CO and CCN.2 concentrations had increased below Localized mixing
My take on mixing Overall there is a strong wind speed with high CO cases at the inversion layer This layer also has consistently higher concentrations of CNhot, CCN.2, CO, etc… Strong wind speed in the entrainment interface layer of an inversion can effectively entrain dry polluted air from the FT to the BL
The overall results Total = 192 cm-3 FT = 125 cm-3 – 65.10% SSA = 15 cm-3 – 7.81% Growth = 50 cm-3 – 26.04% Missing = 2 cm-3 – 1.04% 25% 65% 10% 99.99%
Conclusion • “This work confirms that most of the MBL population is typically resupplied through entrainment from the FT rather than nucleation and growth in the MBL and that the CLAW hypothesis, as proposed, was not operational within the PASE MBL.” • Biomass burning “combustion” in the Amazon basin can be a source for aerosol in the central pacific by long range transport • Transport occurs in the free troposphere and then mixes to the MBL to act a CCN
Criticisms • No cloud droplet concentration data: 139 ± 39 cm-3 (Hudson and Noble 2009) • Do I believe that the sea salt contribution was only 15 cm-3 when CCN.04 difference from BL to FT was 39 cm-3? • Lack of discussion of mixing over the whole project where increased wind speed in the inversion layer in polluted cases creates a mechanism to mix the aerosol from the FT to the BL
References • Charlson, R. J., Lovelock, J. E., Andreae, M. O. and Warren, S. G. (1987). Oceanic phytoplankton, atmospheric sulphur, cloud albedo and climate. Nature326 (6114): 655–661. • Clarke, A. D., Freitag, S., Simpson, R. M. C., Hudson, J. G., Howell, S. G., Brekhovskikh, V. L., Campos, T., Kapustin, V. N., and Zhou, J.: Free troposphere as a major source of CCN for the equatorial pacific boundary layer: long-range transport and teleconnections, Atmos. Chem. Phys., 13, 7511-7529, doi:10.5194/acp-13-7511-2013, 2013. • Hoppel, W. A., Frick, G. M., Fitzgerald, J. W., and Larson, R. E.: Marine boundary layer measurements of new particle formation and the effects nonprecipitating clouds have on aerosol size distribution, J. Geophys. Res., 99, 14443–14459, doi:10.1029/94JD00797, 1994. • Hudson, J. G., and S. Noble (2009), CCN and cloud droplet concentrations at a remote ocean site, Geophys. Res. Lett., 36, L13812, doi:10.1029/2009GL038465. • Woodhouse, M. T., Mann, G. W., Carslaw, K. S., and Boucher, O.: Sensitivity of cloud condensation nuclei to regional changes in dimethyl-sulphide emissions, Atmos. Chem. Phys., 13, 2723-2733, doi:10.5194/acp-13-2723-2013, 2013. • Woodhouse, M. T., Carslaw, K. S., Mann, G. W., Vallina, S. M., Vogt, M., Halloran, P. R., and Boucher, O.: Low sensitivity of cloud condensation nuclei to changes in the sea-air flux of dimethyl-sulphide, Atmos. Chem. Phys., 10, 7545-7559, doi:10.5194/acp-10-7545-2010, 2010.