Download
1 / 18
180 likes | 248 Views
Explore sequential learning in forecasting stock return covariance matrix using dynamic graphical models. Discover how to leverage sparse signals to relax the uncorrelated assumption and enhance performance in portfolio optimization.

E N D
Sequential learning in dynamic graphical model Hao Wang, Craig Reeson Department of Statistical Science, Duke University Carlos Carvalho Booth School of Business, The University of Chicago
Motivating example: forecasting stock return covariance matrix • Observe p- vector stock return time series • Interested in forecast conditional covariance matrix WHY? • Buy dollar stock i • Expected return • Risks
Covariance structure How to forecast: index model Common index Uncorrelated error terms Assumption: stocks move together only because of common movement with indexes (e.g. market)
Uncorrelated residuals? An exploratory analysis on 100 stocks Index explains a lots Possible signals
Sparse signals Seeking structure to relax uncorrelated assumption Perhaps too simple Perhaps too complex
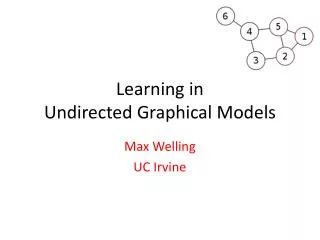
No edge: No edge: Structures: Gaussian graphical model • Graph exhibits conditional independencies • ~ missing edges International exchange rates example, p=11 Carvalho, Massam, West, Biometrika, 2007
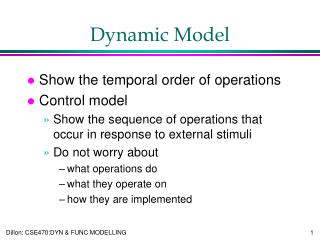
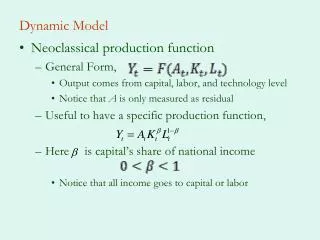
Dynamic matrix-variate models • Example: Core class of matrix-variate DLMs Multivariate stochastic volatility:Variance matrix discounting model for Conjugate, closed-form sequential learning/updating and forecasting (Quintana 1987; Q&W 1987; Q et al 1990s) Multivariate stochastic volatility:Variance matrix discounting model for Conjugate, closed-form sequential learning/updating and forecasting (Quintana 1987; Q&W 1987; Q et al 1990s)
-- Global structure: stochastic change of indexes affecting return of all assets, e.g. SV model -- Local structure: local dependences not captured by index, e.g. graphical model -- Dynamic structure: adaptively relating low dimension index to high dimension returns e.g. DLM
1-step covariance forecasts : Analytic updates Variance from graphical structured error terms Variance from regression vector Random regression vector and sequential forecasting 1-step covariance forecasts : Mild assumption:
Graphical model adaptation • AIM: historical data gradually lose relevance to inference of current graphs • Residual sample covariance matrices
Challenges: Interesting graphs? graphs Keys: >> Analytic evaluation of posterior probability of any graph … Graphical model uncertainty Challenges: Interesting graphs? graphs Graphical model search Jones et al (2005) Stat Sci: static models MCMC Metropolis Hasting Shotgun stochastic search Scott & Carvalho (2008): Feature inclusion
Sequential model search • Time t-1, N top graphs • At time t, • evaluate posterior of top N graphs from time t-1 • Random choose one graph from N graphs according to their new posteriors • Shotgun stochastic search • Stop searching when model averaged covariance matrix estimates does not differ much between the last two steps, and proceed to time t+1
100 stock example • Monthly returns of randomly selected 100 stocks, 01/1989 – 12/2008 • Two index model • Capital asset pricing model: market • Fama-French model: market, size effect, book-to-price effect • , about 60 monthly moving window • How sparse signals help?
Bottom line • For either set of regression variables we chose, we will perhaps be better off by identifying sparse signals than assuming uncorrelated/fully correlated residuals