Download
1 / 33
330 likes | 446 Views
Types of Data: Ratio Specific intervals between consecutive numbers True zero value. Interval level: Specific intervals between consecutive values Zero is just a number in the string. Ordinal level: numbers establish rank order distance between numbers is not any specific interval

E N D
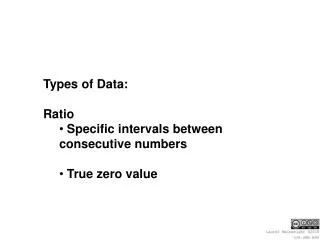
Types of Data: • Ratio • Specific intervals between consecutive numbers • True zero value
Interval level: • Specific intervals between consecutive values • Zero is just a number in the string
Ordinal level: • numbers establish rank order • distance between numbers is not any specific interval • e.g., 1st , 2nd, 3rd...
Nominal level: • Numbers only categorize data. • Numbers have no mathematical value. • e.g., 1 = male, 2 = female
Chi Square Goodness of fit • for nominal level data • identifies if a sample of people conform to the categories as expected.
Where: Chi Square Frequency expected Frequency observed
Frequency expected: The amount of subjects that you would expect to find in each category based on known information.
Frequency observed: The amount of subjects you actually find to be in each category in the present data.
Let’s assume that: h.s. Some college MA Ph.D college 20% 25% 30% 15% 10%
First: How many people do we expect to find in each category, based on these percentages? Assume that the sample that you test has n=50.
The percentage needs to be written as a fraction or decimal.
h.s. Some college MA Ph.D college 20% 25% 30% 15% 10%
h.s. Some college MA Ph.D college 20% 25% 30% 15% 10%
h.s. Some college MA Ph.D college 20% 25% 30% 15% 10%
h.s. Some college MA Ph.D college 20% 25% 30% 15% 10%
h.s. Some college MA Ph.D college 20% 25% 30% 15% 10%
h.s. Some college MA Ph.D college 20% 25% 30% 15% 10% 10 12.5 15 7.5 5
h.s. Some college MA Ph.D college 20% 25% 30% 15% 10% 10 12.5 15 7.5 5 5 7 25 12 1
h.s. Some college MA Ph.D college 10 12.5 15 7.5 5 5 7 25 12 1
h.s. Some college MA Ph.D college 10 12.5 15 7.5 5 5 7 25 12 1
Some college: 1) 3) 2) 4)
h.s. Some college MA Ph.D college 10 12.5 15 7.5 5 5 7 25 12 1
College: 1) 3) 4) 2)
h.s. Some college MA Ph.D college 10 12.5 15 7.5 5 5 7 25 12 1
M.A. 3) 1) 2) 4)
h.s. Some college MA Ph.D college 10 12.5 15 7.5 5 5 7 25 12 1
Ph.D. 1) 3) 2) 4)
Critical Value: Chi Square table df = K-1 where k is # of groups df=4 crit value = 9.488
17.49 > 9.48 Therefore there is a significant difference between the expected and observed frequencies.