Download
1 / 43
430 likes | 658 Views
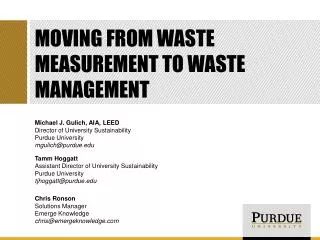
Moving from waste measurement to waste management. Michael J. Gulich , AIA, LEED Director of University Sustainability Purdue University mgulich@purdue.edu Tamm Hoggatt Assistant Director of University Sustainability Purdue University tjhoggatt@purdue.edu Chris Ronson

E N D
Moving from waste measurement to waste management Michael J. Gulich, AIA, LEED Director of University Sustainability Purdue University mgulich@purdue.edu Tamm Hoggatt Assistant Director of University Sustainability Purdue University tjhoggatt@purdue.edu Chris Ronson Solutions Manager Emerge Knowledge chris@emergeknowledge.com
If you can’t measure it, • you can’t manage it. • - Peter Drucker
Purdue university West Lafayette campus • Approximately 40,000 students and over 15,000 faculty and staff • 381 buildings on campus in West Lafayette, IN • Land grant college founded in 1869
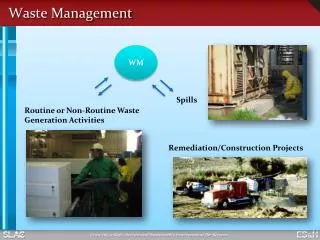
Purdue university Solid waste management
Purdue university Solid waste management philosophy • Single-stream (for the most part) • Separate streams for: • Office paper (includes confidential paper) • High-volume producers of cardboard
Purdue university Solid waste management philosophy • Trash cans removed from all desks in 2009 – went from trash pickup 3x/week to recycling pickup 2x/week • 5,500 recycling containers in residence hall rooms • Narrow definition of landfill trash (academic core): • Food waste • Napkins and tissues • Restroom hand towels
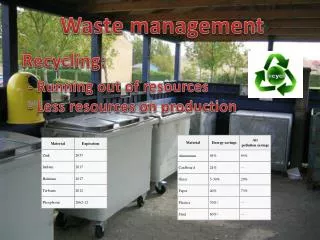
Purdue university Goals of the program • Maximize Purdue’s diversion rate by the most cost-effective and efficient means • Reduce the amount of waste currently landfilled • Raise Purdue’s diversion rate to 85% by 2014 85%by2014
Diversion rate What is diversion rate? • Diversion rate is calculated as: Total Recycling Collected x 100 Total Waste Generated (Recycling Collected + Landfill Trash) Expressed as a %
Diversion rate Purdue’s diversion rates • Traditional Diversion Rate (50% for 2011-12) • Institutional Diversion Rate (80% for 2011-12) • Reported to the public • 85% target by 2014 • Comprehensive Diversion Rate (91% for 2011-12) • Recyclemania Diversion Rate (36% for 2012) • Game Day Challenge Diversion Rate (18% for 2012)
Diversion rate traditional diversion rate • Traditional Diversion Rate (50% for 2011-12)
Diversion rate traditional diversion rate
Diversion rate institutional diversion rate • Institutional Diversion Rate (80% for 2011-12)
Diversion rate comprehensive diversion rate • Comprehensive Diversion Rate (91% for 2011-12)
Diversion rate National standards • No national standard for what is in the diversion rate • AASHE STARS (v1.2) • OP Credit 18: Waste Diversion – materials destined for disposal in a landfill or incinerator but diverted by recycling, composting, reuse, donation, or resale – does not include construction, demolition, electronic, hazardous, special, universal and non-regulated chemical waste • OP Credit 19: C&D Waste Diversion • OP Credit 20: Electronic Waste Recycling
Landfilled Material Alternative metric
Waste audits Residence halls • Cary Quad – Floor 3 • 10% Landfill | 90% Recycling
Waste audits Residence halls • Cary Quad – Floor 4 • 5% Landfill | 95% Recycling
Waste audits Residence halls • Harrison Hall • 10% Landfill | 90% Recycling
Waste audits Residence halls • Meredith Hall – Floor 3 • 10% Landfill | 90% Recycling
Waste audits Residence halls • Harrison Hall • 50% Landfill | 50% Recycling
Waste audits Shreve hall | eco-reps
Waste audits Shreve hall | eco-reps
Waste audits Rawls hall | LEED-EB:O+M
Waste audits Rawls hall | LEED-EB:O+M
recyclemania Opportunity for new data • No national standard for what is in the diversion rate • AASHE STARS (v1.2) • OP Credit 18: Waste Diversion – materials destined for disposal in a landfill or incinerator but diverted by recycling, composting, reuse, donation, or resale – does not include construction, demolition, electronic, hazardous, special, universal and non-regulated chemical waste • OP Credit 19: C&D Waste Diversion • OP Credit 20: Electronic Waste Recycling
recyclemania Recycle madness results • Diversion Rate During Recyclemania • University Residences = 24.45% • Campus Average = 38.51% • Academics Campus = 52.57%
Game day challenge Alcoa foundation action to accelerate grant
Game day challenge Alcoa foundation action to accelerate grant • Year 1 (2012) Target = 20% diversion rate • Year 2 (2013) Target = 50% diversion rate 18.3% 15.1% 11.8% 11.4% 7.6% 7.4% 5.3%
Search for dynamic tracking tool NEEDS for tracking tool • Real time tracking – not end of year • Monthly data • Trending analytics • Simplify reporting on campus • One source of data • Eliminate multiple spreadsheets • Departments to have ownership of their waste stream data and to have access to analytics (peer pressure) • Scalable
Search for dynamic tracking tool Evaluation criteria for tracking tool selection • Are all of Purdue’s waste streams supported? • How many users are supported? • What is level of security / are there administrator rights? • What analytics / reporting are available? • Is customer support provided during piloting & setup? • Can it track Purdue’s historical diversion rates? • Can users edit data entry ‘tickets’? • Is who entered the data tracked? • What does the package cost? • Is it user friendly?
Re-trac connect Pilot phase
Re-trac connect Pilot phase
Re-trac connect Training & Implementation • Departments trained to-date: • Grounds • Gravel Pit Operation • Materials Management & Distribution • Warehouse & Surplus • Radiological & Environmental Services • Departments to be trained: • University Residences • Physical Facilities • Purdue Memorial Union (PMU) • Food Stores • Smith Hall (academic butcher shop) • Wade Power Plant • Transportation Services
Re-trac connect Training & Implementation
Re-trac connect analytics
Re-trac connect analytics
Re-trac connect analytics
Re-trac connect analytics
Re-trac connect analytics
Re-trac connect Lessons learned • Diversion rate can be a good metric, but it’s not the whole picture • Too much data is never enough • Be consistent, but don’t necessarily be bound by your historical data categories • Ask lots of questions • Don’t assume past tracking data is complete
Re-trac connect Lessons learned • Don’t assume each department is capturing all their recycling data • Even though departments furnished total recycling amounts, we learned departments were tracking streams much more granularly than we assumed • You can NEVER have enough trending reports • No matter how thorough training was and how detailed the training materials are, you still need to audit the data • Garbage in, garbage out