Spatially Complete Global Surface Albedos Derived from Terra/MODIS Data
270 likes | 438 Views
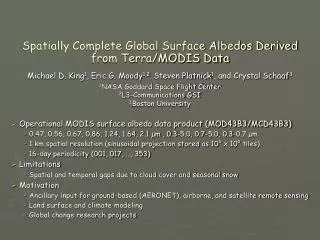
Spatially Complete Global Surface Albedos Derived from Terra/MODIS Data. Operational MODIS surface albedo data product (MOD43B3/MCD43B3) 0.47, 0.56, 0.67, 0.86, 1.24, 1.64, 2.1 µm , 0.3-5.0, 0.7-5.0, 0.3-0.7 µm 1 km spatial resolution (sinusoidal projection stored as 10° x 10° tiles)

Spatially Complete Global Surface Albedos Derived from Terra/MODIS Data
E N D
Presentation Transcript
Spatially Complete Global Surface Albedos Derived from Terra/MODIS Data • Operational MODIS surface albedo data product (MOD43B3/MCD43B3) • 0.47, 0.56, 0.67, 0.86, 1.24, 1.64, 2.1 µm , 0.3-5.0, 0.7-5.0, 0.3-0.7 µm • 1 km spatial resolution (sinusoidal projection stored as 10° x 10° tiles) • 16-day periodicity (001, 017, …, 353) • Limitations • Spatial and temporal gaps due to cloud cover and seasonal snow • Motivation • Ancillary input for ground-based (AERONET), airborne, and satellite remote sensing • Land surface and climate modeling • Global change research projects Michael D. King1, Eric G. Moody1,2, Steven Platnick1, and Crystal Schaaf3 1NASA Goddard Space Flight Center 2L3-Communications GSI 3Boston University
IGBP Ecosystem Classification (MOD12Q1) 0 Water 6 Closed Shrublands 12 Croplands 1 Evergreen Needleleaf Forest 7 Open Shrublands 13 Urban and Built-Up 2 Evergreen Broadleaf Forest 8 Woody Savannas 14 Cropland/Natural Veg. Mosaic 3 Deciduous Needleleaf Forest 9 Savannas 15 Snow and Ice 4 Deciduous Broadleaf Forest 10 Grasslands 16 Barren or Sparsely Vegetated 5 Mixed Forests 11 Permanent Wetlands
Grasslands 7.30% Equal Area IGBP Ecosystem Classification Statistics Permanent Snow 11.31% Barren / Desert 13.00% Wetlands 0.33% Savanna 6.63% Cropland Woody Savanna 10.09% Other Veg 6.32% 13.93 % Urban 0.17% Open Shrubs 18.86% Crop Mosaic 3.34% Evrg. Needle Forest Closed Shrubs Evrg. Broad Forest 4.19% 0.63% 10.38% Mixed Forest Decd. Needle Forest Decd. Broad Forest 4.85% 1.40% 1.19%
General Methodology • Compute regional ecosystem statistics • 0.5°, 1-5°, 10°, 10°x20°, 10°x30° box sizes • Obtain pixel-level and regional ecosystem statistical phenological trends • Curves will have different magnitudes • Shapes will be consistent • Impose shape of curves onto pixel level data • Only 10-15% of pixels have adequate coverage to obtain phenology • Maintains pixel level detail with appropriate phenology • Select curve that has best representation • Representation of existing pixel data • Completeness of trend • Bias towards smaller statistical box sizes • Fill missing values with selected curve
Processing Preparation • Prepare MOD43B3 data • Mosaic SIN data onto 1-minute climate modeling grid • Apply MOD43B3 QA • Remove lesser quality pixels • Remove seasonal snow • Prepare MOD12Q1 data • Mosaic SIN data onto 1-minute climate modeling grid • Compute regional ecosystem statistics • CMG grids at 0.5°, 1-5°, 10°, 10°x20°, 10°x30° • A priori computation
Phenological Curves for Deciduous Broadleaf ForestVermont, USA Phenological Curves Phenological Curves with Offset Applied
Seasonal Snow Methodology • Cloud and snow cover obscure full decay state • Over hemisphere average of high latitudes • Unique ecosystem and wavelength extrema percent change • Compute % change from pixels with adequate representation • For each pixel/statistical curve • Pin winter endpoints with value computed from • Percent change • Summer extrema • Then apply General Methodology
Persistent Cloud Methodology • Clouds obscure trends over large regions • Usually full growth stage is obscured • Even 10°x30° boxes may not observe complete temporal trend • Compute 1 statistical curve per ecosystem class • 5°-15° Latitude belts • Centered around pixel’s latitude • Yearly phenological behavior curves • Instead of 2 half year curves • Impose shape of curve onto existing pixel data
Africa in the Presence of Persistent CloudsDecember 3-18, 2002
Spectral Variability by Ecosystem ClassJune 26 - July 11, 2001
Temporal Variability by Ecosystem ClassJanuary - July 2001 Cropland Ecosystem Urban Ecosystem
Available Products • 2001 (v3) and 2002 (v4) spatially complete albedo maps • Maps and QA stored in 1-minute rectangular coordinates • First seven MODIS wavelengths and 3 broadband • White- and black-sky albedo values • Currently processing 2000-2004 (v4) • 2001 (v3) and 2002 (v4) statistics of filled albedo maps • 0.5°, 1°, 2°, 3°, 4°, 5°, 10° box sizes • Statistics computed in boxes and by ecosystem class in boxes • Statistics of snow albedos • Hemispheric averages of MOD43B3 validated data • Separated by ecosystem class and NISE wet/dry classification • IGBP ecosystem classification map • Maps and QA stored in 1-minute rectangular coordinates
Land Surface Albedo Data Distribution modis-atmos.gsfc.nasa.gov • Acquiring data • Anonymous FTP • Via website • Direct link • Available • Albedo maps • Albedo QA maps • Albedo statistics • Ecosystem map • Snow albedo statistics • NDVI • Images and movies
Spectral Albedo of Snow • Used near real-time ice and snow extent (NISE) dataset • Distinguishes land snow and sea ice (away from coastal regions) • Identifies wet vs dry snow • Projected onto an equal-area 1’ angle grid • Aggregate snow albedo from MOD43B3 product • Surface albedo flagged as snow • Aggregate only snow pixels whose composite NISE snow type is >90% is flagged as either wet or dry snow in any 16-day period • Hemispherical multiyear statistics • Separate spectral albedo by ecosystem (MOD12Q1) • Results represent ‘average’ snow conditions • Additional sources of variability include snow depth, snow age, grain size, contamination (soot), and, in the case of black-sky albedo, solar zenith angle
Snow Albedo by Forest EcosystemsNorthern Hemisphere Multiyear Average (2000-2004)
Snow Albedo for Sparse Vegetation EcosystemsNorthern Hemisphere Multiyear Average (2000-2004)
Spatially Complete White-Sky AlbedoJanuary 1-16, 2002 Snow-free 0.8 0.6 Surface Albedo (0.86 µm) Snow-covered 0.4 0.2 0.0
Summary and Conclusions • Spatially complete surface albedo datasets have been generated • Uses high-quality operational MODIS surface albedo dataset • Imposes phenological curve and ecosystem-dependent variability • White- and black-sky albedos produced for 7 spectral bands and 3 broadbands • See modis-atmos.gsfc.nasa.gov for data access and further descriptions, and • Moody, E. G., M. D. King, S., Platnick, C. B. Schaaf, and F. Gao, 2005: Spatially complete global spectral surface albedos: Value-added datasets derived from Terra MODIS land products. IEEE Trans. Geosci. Remote Sens., 43, 144-158. • Spectral albedo of snow • Hemispheric averages of MOD43B3 validated data • Separated by ecosystem class and NISE wet/dry classification • Additional variability due to snow depth, age, grain size, and contamination not accessible from MODIS data alone, and hence not incorporated