Download
1 / 19
190 likes | 366 Views
Analysis of Simultaneous Nadir Observations of MODIS from AQUA and TERRA. Andrew Heidinger and many others NOAA/NESDIS Office of Research and Applications Cooperative Institute for Meteorological Satellite Studies (CIMSS) Madison, Wisconsin March 22, 2005. Introduction.

E N D
Analysis of Simultaneous Nadir Observations of MODIS from AQUA and TERRA Andrew Heidinger and many others NOAA/NESDIS Office of Research and Applications Cooperative Institute for Meteorological Satellite Studies (CIMSS) Madison, Wisconsin March 22, 2005
Introduction • Polar orbiting satellites intersect each other at high latitudes. This occurs for satellites even in very different orbits. • Analysis of Aqua and Terra data from one month results in multiple simultaneous nadir observations (SNO). • We have primarily analyzed MODIS and AVHRR SNO data as part of a NOAA Scientific Data Stewardship Project. • We are interesting in pursuing the utility of the AQUA/TERRA in resolving remaining issues in differences in some products. Taken from Changyong Cao: http://www.orbit.nesdis.noaa.gov/smcd/spb/calibration/intercal/
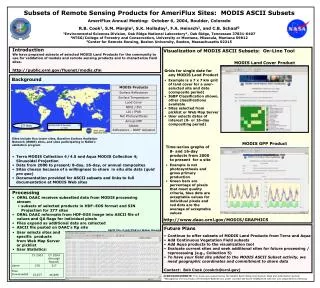
Example Imagery from a SNO Sensor #1 data projected on to Sensor #2 strip. These points comprise the SNO ± 5° Nadir Strip from Sensor #1 ± 5° Nadir strip from Sensor #2
Some Details • Data source was the MOD02 5km sub sampled HDF version 4 • Data from both hemispheres for July 2003 and 2004 were analyzed. • We mapped the pixel data into 55 km cells. All cells that meet the criteria were used. One SNO event generally covers multiple cells. • The SNO criteria were set to 10 minutes and 5 degrees from nadir which resulted in about 100 matching grid cells per month. • Cells with brightness temperature differences between AQUA and TERRA in band 31 greater than 4 K were assumed to be outliers and excluded.
Results for Band 1 Stats for Aqua-Terra Mean = 0.35 % Stan. Dev. = 2.4 % N = 75
Results for Band 2 Stats for Aqua-Terra Mean = -0.012 % Stan. Dev. = 2.5 % N = 80
Results for Band 27 Stats for Aqua-Terra Mean = -0.6 K Stan. Dev. = 0.8 K N = 269
Results for Band 28 Stats for Aqua-Terra Mean = -0.5 K Stan. Dev. = 1.4 K N = 265
Results for Band 31 Stats for Aqua-Terra Mean = -0.3 K Stan. Dev. = 1.4 K N = 246
Results for Band 32 Stats for Aqua-Terra Mean = -0.3 K Stan. Dev. = 1.4 K N = 247
Results for Band 33 Stats for Aqua-Terra Mean = -0.2 K Stan. Dev. = 1.1 K N = 260
Results for Band 34 Stats for Aqua-Terra Mean = -0.2 K Stan. Dev. = 1.0 K N = 267
Results for Band 35 Stats for Aqua-Terra Mean = -0.7 K Stan. Dev. = 0.8 K N = 268
Results for Band 36 Stats for Aqua-Terra Mean = -1.0 K Stan. Dev. = 0.6 K N = 270
Modeled Band to Band Differences It is important to note that differences in the AQUA and TERRA SRFs will cause differences between each instrument for the same bands. Using MODTRAN, with the mean SRFs, gives the following predicted differences (AQUA – TERRA) in K for several standard profiles Atmos. 27 28 31 32 33 34 35 36 ----------------------------------------------------------------------------------------------- Trop. 0.49 0.19 0.03 -0.02 0.06 -0.2 -0.71 -1.4 MLS 0.49 0.19 0.03 -0.01 0.06 -0.14 -0.65 -1.04 SAS 0.39 0.18 0.03 -0.01 0.05 -0.11 -0.56 -0.68 SAW 0.44 0.09 0.03 -0.00 0.02 -0.12 -0.42 -0.73 SNO -0.6 -0.5 -0.3 -0.3 -0.2 -0.2 -0.7 -1.0 Bands 27, 28,31 and 32 have mean AQUA-TERRA differences observed by SNO that are outside range predicted by modeling. If this simplistic modeling is credible, AQUA-TERRA difference should smaller in magnitude as scene temperature decreases for clear skies.
Conclusions • NOAA/NESDIS is using SNOs between MODIS and AVHRR data to improve the AVHRR reflectance calibration (including Fred Wu and Changyong Cao). • The SNO analysis applied to AQUA and TERRA overpasses yields estimates in the relative biases of the nadir observations. • Bands 1 and 2 seem to be in good agreement. • For bands 27-28 and 31-36, TERRA is warmer than AQUA on average with the mean biases (AQUA – TERRA) ranging from -0.2 to -1.0 K. There is a spectral and scene temperature dependence in the biases. The biases for bands 34-36 are within ranges computed for clear-skies – the others are not. • Future work will include using AIRS data which also available at the SNOs. • In addition, we will switch to 1 km data to be able to compare all detectors.
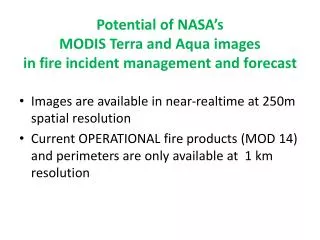
The Band 31 Results are on the same order as that seen from SNO observations from two AVHRR’s (NOAA-14 and NOAA-12)
MODIS 0.86 mm Reflectance AVHRR Ch2 (0.86 mm) Count AVHRR has no onboard reflectance calibration. Using SNO’s between MODIS and AVHRR allow us to transfer MODIS’s calibration to the AVHRR