Download

1 / 15
160 likes | 322 Views
PREDICTION OF MAXIMUM DAILY OZONE LEVELS USING NEURAL NETWORK MODELS IN BANGKOK. by L.H. NGHIEM and N.T. KIM OANH Environmental Engineering and Management, SERD, Asian Institute of Technology - AIT. OUTLINE OF THE PRESENTATION. Overview ozone pollution in Bangkok

E N D
PREDICTION OF MAXIMUM DAILY OZONE LEVELS USING NEURAL NETWORK MODELS IN BANGKOK by L.H. NGHIEM and N.T. KIM OANH Environmental Engineering and Management, SERD, Asian Institute of Technology - AIT
OUTLINE OF THE PRESENTATION • Overview ozone pollution in Bangkok • Overview of (ANN) model and its application in air quality modeling • Develop a Artificial Neural Network model for predicting daily maximum 1-hr ozone levels at Bangkok urban area for ozone season (January-April).
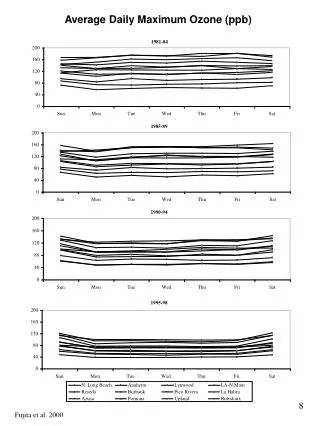
OZONE POLLUTION IN BANGKOK (1) • There are 13 stations of the ambient air quality monitoring network in Bangkok: 3 curbside stations + 10 general ambient stations • Only 11 stations have O3 monitoring data. Analysis of ozone pollution using the available monitoring data shown that: • The curbside stations are characterized by lower frequency of O3 exceeding the Thailand AAQS than general ambient stations. • Highest maximum 1-hr hourly O3 levels and highest frequency of O3 exceeding the standard were recorded at ambient stations at a distance from the city center.
OZONE POLLUTION IN BANGKOK (2) Ozone season in BKK • High O3 pollution in Bangkok occur mainly in the period from January to April (winter and local summer) and lowest during mid-rainy season (Zhang and Kim Oanh, 2002) • Highest O3 concentrations in Bangkok occur in the period from 13:00-15:00 (LST).
OVERVIEW OF ARTIFICIAL NEURAL NETWORKS (ANN) • ANN are computer programs designed to simulate biological neural networks (e.g. the human brain) in terms of learning (training) algorithms. • The most popular topology is feed-forward neural network, multi-layer perceptron (MLP). An overview of MLP applications in atmospheric science can be found in Gardner and Dorling (1998). • In recent year, ANN have been investigated for use in air quality modeling and given acceptable results for atmospheric pollution forecasting of pollutants such as SO2, ozone and PM10. • ANN can be trained to identify patterns and extract trends in imprecise and complicated nonlinear data (allows for non-linear relationships between variables) • Ozone in the lower atmosphere is a complex non-linear process. Therefore, ANN is a well-suited method ozone prediction.
INPUT LAYER HIDDEN LAYER OUTPUT LAYER Meteorological and air quality input data Node (Neuron) I1 Wh11 1 1 Wh12 Wh1m Wo1o I2 Wo2o Ozone prediction Output Node 2 2 Whi1 Womo m i Whi2 Ii I M Processing at each output node: 1. Weight the transformed hidden layer output and sum: 2. Transform sum using transfer function and output ozone prediction: Whim Processing at each hidden node: 1. Weight input variables and sum: 2. Transform sum using transfer function: Transfer (activation) function 1. Logistic Sigmoid function with the range [0, 1]: 2. Hyperbolic tangent function with the range [0, 1]: 3. Gaussian function: 4. Linear function:
DEVELOPMENT ANN MODEL FOR PREDICTION MAXIMUM 1-hr OZONE LEVEL IN BANGKOK(INPUT DATA) I. Air quality data: • Collected from Pollution Control Department (PCD) during 1 January to 30 April for the years 2000-2003. • The highest values of daily maximum 1-hr O3 concentrations observed among of the monitoring stations, i.e. the domain peak O3 • The domain average values for THC, NO and NO2 between 6:00 a.m. and 9:00 a.m. of the day of interest. II. Meteorological data:(the same period as the air quality data) • Observations at the Bangkok Metropolis station (in the city center) were obtained from Thai Meteorological Department (TMD). • The selected meteorological variables included wind speed (m/sec), wind direction (WDI), relative humidity (%), solar radiation (W/m2), and daily maximum temperature (oC). • Utilized the average values for the selected variables between 6 a.m. to 10 a.m of hourly observations in the morning of the day of interest.
THC ARTIFICIAL NEURAL NETWORK MODEL NO NO2 Tmax Eight input variables Maximum O3 level WS WDI RH SOLAR CONSTRUCTION OF ANN MODEL IN THIS STUDY • MLP network were selected to develop the prediction model for maximum O3 level. • The MLP network was trained using Levenberg-Marquardt back-propagation of MATLAB Neural Network Toolbox. • The input data set including 481 rows (patterns) were RANDOMLY split into two sets: training set of 361 patterns for training the network, and the remaining dataset of 114 patterns for the testing the network. • Number of hidden layer and hidden nodes, and connection weights between neurons of the MLP network were determined by an iterative process in training (learning) stage
EVALUATION OF PERFORMANCE OF THE ANN MODEL Performance statistics • Mean Absolute Error (MAE) • Root Mean Square Error (RMSE) • Coefficient of Determination (R2) • Index of Agreement (d)
RESULTSARCHITECTURE AND PERFORMANCE OF MLP The Best MLP MLP 8-10-12-1 MLP 8-10-14-1
RESULTS OF MLP NETWORK WITH ARCHITECTURE 8-10-14-1 Comparison of predicted and observed ozone levels for the testing dataset Scatter plot of predicted versus observed values Testing dataset Training dataset
RESULTS OF LINEAR REGRESSION MODEL (1) • The final regression model using stepwise procedure as follow: • Stepwise regression results is shown in the table:
COMPARISON OF OZONE PREDICTION MODELS ON THE TESTING DATA SET
DISCUSSION • The MLP model was developed for Bangkok urban area and should be consider specific to this area. • The specific model was developed on data cover period January 1-April 30 ozone season in Bangkok: Minimized effect of season factors in the model May not be appropriate to use the model for other seasons • The results of ANN model in Bangkok are with in the range of the results reported in previously published studies
CONCLUSIONS AND RECOMMENDATIONS • This study shows that the ANNs can be used in air pollution modeling, e.g. predicting the daily maximum 1-hr ozone levels. • These ANNs can be a simple alternative model to provide reliable estimates of pollution by using only limit information. • Modification and improvement of the models should be done to develop a reliable model for ozone forecasting in Bangkok urban area.