Download
1 / 25
250 likes | 364 Views
Ken Chapman Oil Sands Developers Group January 25, 2012. Sustainable Community Indicators. Cost of living Housing availability Philanthropy Crime Health care Public transit. Indicators of Community Wellness. 2003 - 2006

E N D
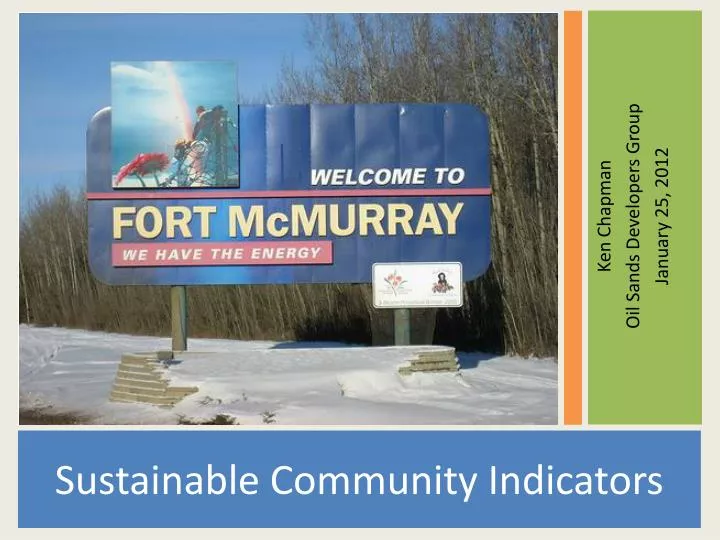
Ken Chapman Oil Sands Developers Group January 25, 2012 Sustainable Community Indicators
Cost of living Housing availability Philanthropy Crime Health care Public transit Indicators of Community Wellness
2003 - 2006 Development of Indicators and Initial Report on Sustainable Community Indicators By Regional Municipality of Wood Buffalo Suncor Athabasca Regional Working Issues Group Community Stakeholders 2011 Update on Sustainable Community Indicators By Oil Sands Developers Group
Cost of Living Housing Affordability Crime Rate Traffic Collision Rate Philanthropy Voter Participation Rental Vacancy Public Transit Use Physician to Resident Ratio Emergency Room Performance Educational Attainment 17 Indicators of the Original 21 Updated
Pillars of Community Sustainability Social Economic Environmental
Cost of Housing Versus Income
Highway Of Death? Or Just Perception?
Traffic Collision Rate Highway 63, North of Fort McMurray
Traffic Collision Rate Highway 63, South of Fort McMurray (Hwy 881 – Hwy 55)
Public Transit Use
RMWB Social Prosperity – How Do We Rank? Health Education Access Inclusion Safety Affordability And What Are The Challenges?
Improving affordability but continuing housing challenges • Crime rate growth but improving road safety • Growth in philanthropy • Continuing physician ratio challenges but improving Emergency Department Performance
The Proposal Use the sustainable community indicators to not only measure social prosperity but as a means to focus non-profit services Develop a more robust set of indicators by engaging the RMWB and stakeholders, including non-profit organizations