Sensitivity Analysis in Bayesian Networks by Adnan Darwiche
Explore the impact of parameter changes on Bayesian network queries, efficiency in identifying minimal changes, choosing among candidates, and measuring change. Learn about reasoning, false positives/negatives, and bounding query changes.


Sensitivity Analysis in Bayesian Networks by Adnan Darwiche
E N D
Presentation Transcript
Sensitivity Analysis inBayesian Networks Adnan Darwiche Computer Science Department http://www.cs.ucla.edu/~darwiche A. Darwiche
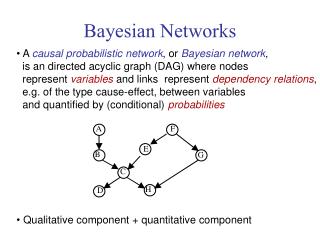
How will this parameter change impact the value of an arbitrary query Pr(y|e)? Ex: How will this parameter change affect the query Pr(BP = Low | HR = Low)? A. Darwiche
Now Pr(BP = Low | HR = Low) = 0.69, but experts believe it should be >= 0.75. How do we efficiently identify minimal parameter changes that can help us satisfy this query constraint? A. Darwiche
How do we choose among these candidate parameter changes? How do we measure and quantify change? Absolute? Relative? Or something else? A. Darwiche
Naïve Bayes classifier Class variable C Attributes E A. Darwiche
System Schematic .99 T .999 P .99 R R R .995 S S S 1 2 3 P: A power supply for whole system T: Transmitter: generates to bus (generates no data when faulty) R: Receiver: receives data if available on bus S: Sensor: reflects status of data on receiver (fails low) Reliability of each component is shown next to it A. Darwiche
Now Pr(BP = Low | HR = Low) = 0.69, but experts believe it should be >= 0.75. How do we efficiently identify minimal parameter changes that can help us satisfy this query constraint? A. Darwiche
From global to local belief change • Goal: for each network parameter qx|u, compute the minimal amount of change that can enforce query constraints such as: • Pr(y|e) ³ e. • Pr(y|e) – Pr(z|e) ³ e. • Pr(y|e) / Pr(z|e) ³ e. A. Darwiche
Computing the partial derivative • For each network parameter qx|u, we introduce a meta parameter tx|u, such that: • Our procedure requires us to first compute the partial derivative ¶ Pr(e) / ¶tx|u: A. Darwiche
Parameter changes • Result: to ensure constraint Pr’(y|e) ³ e, we need to change the meta parameter tx|u by dsuch that: The solution is either d q or d³ q. If the change is invalid, the parameter is irrelevant. We have to compute the solution of d for every parameter in the Bayesian network. A. Darwiche
Complexity • Time complexity: O(n 2w), where n is the number of variables, and w is the treewidth. • This time complexity is the same as performing inference to find Pr(e), the simplest query possible. • Therefore, this procedure is very efficient, since we are not paying any penalty by computing the partial derivatives. A. Darwiche
Reasoning about Information • Understand the impact of new information on situation assessment and decision making • What new evidence would it take, and how reliable should it be, to confirm a particular hypothesis? A. Darwiche
False positive is 10% False negative is 30% A. Darwiche
Need probability of pregnancy to be <= 5% given three tests are negative Get a better scanning test: false negative from 10% to 4.6% Other tests irrelevant! A. Darwiche
Current Work… • Multiple parameters: • Same CPTs • Multiple CPTs • Multiple constraints A. Darwiche
How will this parameter change impact the value of an arbitrary query Pr(y|e)? A. Darwiche
Bounding the partial derivative Key result: the network-independent bound on the partial derivative: A. Darwiche
Plot of the bound A. Darwiche
Bounding query change due to infinitesimal parameter change • We apply an infinitesimal change Dtx|u to the meta parameter tx|u, leading to a change of D Pr(y|e) (we assume tx|u£ 0.5). • Result: the relative change in the query Pr(y|e) is at most double the relative change in the meta parameter tx|u: A. Darwiche
Bounding query change due to arbitrary parameter change If the change in x|u is positive: If the change in x|u is negative: Combining both results, we have: A. Darwiche
= false = true Bounding query change: example Pr(fire | e) = 0.029 Pr’(fire | e) = ? Pr’(fire | e) = [0.016, 0.053] Exact value: 0.021 A. Darwiche
Permissible changes for Pr(x|u) to ensure robustness Pr(y|e) = 0.9 • The graphs analytically show that the permissible changes are smaller for non-extreme queries. • Moreover, we can afford more absolute changes for non-extreme parameters. Pr(y|e) = 0.6 A. Darwiche
A probabilistic distance measure D(Pr, Pr’) satisfies the three properties of distance: positiveness, symmetry, and the triangle inequality. A. Darwiche
max Pr’(w) / Pr(w) min Pr’(w) / Pr(w) A B C Pr’(A,B,C) Pr’(w) / Pr(w) Pr(A,B,C) a b c 0.10 0.20 2.00 a b c 0.20 0.30 1.50 a b c 0.25 0.10 0.40 a b c 0.05 0.05 1.00 a b c 0.05 0.10 2.00 a b c 0.10 0.05 0.50 a b c 0.10 0.10 1.00 a b c 0.15 0.10 0.67 A. Darwiche
Distance Properties Measure satisfies properties of distance: • Positiveness:D(Pr, Pr’) >= 0, and D(Pr, Pr’) = 0 iff Pr = Pr’ • Symmetry:D(Pr, Pr’) = D(Pr’, Pr) • Triangle inequality:D(Pr, Pr’) + D(Pr’, Pr’’) >= D(Pr, Pr’’) A. Darwiche
Significance of distance measure • Let: • Pr and Pr’ be two distributions. • and be any two events. • Odds of | under Pr: O( | ). • Odds of | under Pr’: O’( | ). • Key result: we have the following tight bound: A. Darwiche
Bounding belief change • Given Pr and Pr’: • p = Pr( | ) • d = D(Pr, Pr’) • What can we say about Pr’( | )? A. Darwiche
Bounding belief change d = 0.1 d = 1 A. Darwiche
Comparison with KL-divergence • KL-divergence is incomparable with our distance measure. • We cannot use KL-divergence to guarantee a similar bound provided by our distance measure. • Our recent work suggests that KL-divergence can be viewed as an average-case bound, and our distance measure as a worst-case bound. A. Darwiche
parameter change Applications to Bayesian networks What is the global impact of this local parameter change? A. Darwiche
Distance between networks • N’ is obtained from N by changing the CPT of X from X|u to ’X|u. • N and N’ induce distributions Pr and Pr’. A. Darwiche
= false = true Bounding query change: example Pr(fire | e) = 0.029 Pr’(fire | e) = ? Pr’(fire | e) = [0.016, 0.053] A. Darwiche
Jeffrey’s Rule • Given distribution Pr: • Given soft evidence: A. Darwiche
Jeffrey’s Rule If w is a world that satisfies i: A. Darwiche
Example of Jeffrey’s Rule A piece of cloth:Its color can be one of: green, blue, violet.May be sold or unsold the next day. A. Darwiche
Example of Jeffrey’s Rule Given soft evidence:green: 0.7, blue: 0.25, violet: 0.05 0.7 / 0.3 0.25 / 0.3 0.05 / 0.4 A. Darwiche
Bound on Jeffrey’s Rule • Distance between Pr and Pr’: • Bound on the amount of belief change: A. Darwiche
P Pr(p) Pregnant? yes 0.87 (P) no 0.13 Urine test Blood test Scanning test (U) (B) (S) P U Pr(u|p) P B Pr(b|p) P S Pr(s|p) yes -ve 0.27 yes -ve 0.36 yes -ve 0.10 no +ve 0.107 no +ve 0.106 no +ve 0.01 From Numbers to Decisions Test results: U, B, S Decision Function + Probabilistic Inference Yes, No A. Darwiche
P Pr(p) Pregnant? yes 0.87 (P) no 0.13 Urine test Blood test Scanning test (U) (B) (S) P U Pr(u|p) P B Pr(b|p) P S Pr(s|p) yes -ve 0.27 yes -ve 0.36 yes -ve 0.10 no +ve 0.107 no +ve 0.106 no +ve 0.01 From Numbers to Decisions Situation: U=+ve, B=-ve, S=-ve U +ve - ve B - ve +ve S +ve + Probabilistic Inference - ve Yes No Ordered Decision Diagram A. Darwiche
X1 X2 X2 X3 X3 1 0 Binary Decision Diagram Test-once property A. Darwiche
Improving Reliability of Sensors Yes if > 90% Pregnant? (P) Urine test Blood test Scanning test (U) (B) (S) Currently False negative 27.0% False positive 10.7% Same decisions (in all situations) if new test is: False negative 10% False positive 5% Different decisions (in some situations) if new test: False negative 5% False positive 2.5% Can characterize these situations, compute their likelihood, analyze their properties A. Darwiche
Adding New Sensors Yes if > 90% Pregnant? (P) Urine test Blood test Scanning test New test (U) (B) (S) (N) Same decisions (in all situations) if: False negative 40% False positive 20% Different (in some situations) decisions if: False negative 20% False positive 10% Can characterize these situations, compute their likelihood, analyze their properties A. Darwiche