Download
1 / 1
10 likes | 96 Views
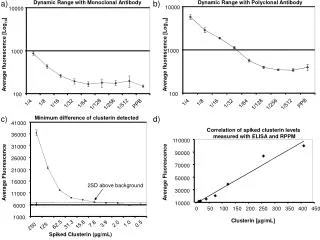
This study measures the dynamic range sensitivity of monoclonal and polyclonal antibodies for detecting clusterin levels. Correlation between ELISA and RPPM methods is evaluated. Results show differences in fluorescence levels and Clusterin concentrations.

E N D
a) b) Dynamic Range with Monoclonal Antibody Dynamic Range with Polyclonal Antibody 10000 10000 1000 1000 Average fluorescence [Log10] Average fluorescence [Log10] 100 100 1/4 1/8 1/4 1/8 PPB 1/16 1/32 1/64 1/16 1/32 1/64 PPB 1/128 1/256 1/512 1/128 1/256 1/512 c) d) Minimum difference of clusterin detected 41000 Correlation of spiked clusterin levels measured with ELISA and RPPM 36000 110000 31000 90000 26000 70000 21000 Average Fluorescence Average Fluorescence 50000 16000 2SD above background 30000 11000 10000 6000 0 50 100 150 200 250 300 350 400 450 1000 Clusterin [µg/mL] 7.8 3.9 2.0 1.0 0.5 62.5 15.6 31.3 250 125 Spiked Clusterin (µg/mL)