Download
1 / 75
1.17k likes | 1.94k Views
X-RAY FLUORESCENCE (XRF) AN ANALYTICAL CHEMISTRY PERSPECTIVE. This work is licensed under the Creative Commons Attribution-ShareAlike 3.0 Unported License. WHAT IS XRF?. X-ray Fluorescence Spectrometry An elemental analysis technique Another acronym to remember

E N D
X-RAY FLUORESCENCE (XRF) AN ANALYTICAL CHEMISTRY PERSPECTIVE This work is licensed under the Creative Commons Attribution-ShareAlike 3.0 Unported License
WHAT IS XRF? • X-ray Fluorescence Spectrometry • An elemental analysis technique • Another acronym to remember • A new scientific gadget to play with • The closest thing we have to a tricorder • An advanced, highly automated, portable analytical tool that can be used by scientists, lab staff, field investigators, and even non-experts to support their job functions • All of the above
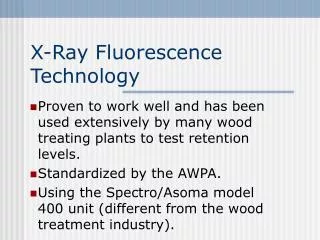
TYPICAL APPLICATIONS OF XRF • XRF is currently used in many different disciplines: • Geology • Major, precious, trace element analysis • Characterization of rocks, ores, and soils Environmental Remediation • Pb in paint • Heavy metals in soil (EPA method 6200) Recycling • Alloy identification • Waste processing Miscellaneous • Art and archeology • Industrial hygiene • Forensics
OUTLINE 1. INTRODUCTION The electromagnetic spectrum and X-rays Basic theory of XRF and simple XRF spectra Different types of XRF instruments 2. INTERPRETATION OF XRF SPECTRA XRF spectra of different elements Limited resolution and overlapping peaks Artifact peaks 3. QUALITATIVE AND QUANTITATIVE ANALYSIS Confirmation of detection of an element Different calibration models Example calibration curves 4. APPLICATIONS OF XRF Screening for toxic elements in large numbers of samples Accurate quantitative analysis of target elements in various matrices 5. CONCLUSIONS XRF advantages and limitations References and additional reading
THE ELECTROMAGNETIC SPECTRUM How does light affect molecules and atoms? D.C. Harris, Quantitative Chemical Analysis, 7th Ed., Freeman, NY, 2007.
X-RAY INTERACTIONS WITH MATTER • When X-rays encounter matter, they can be: • Absorbed or transmitted through the sample (Medical X-Rays – used to see inside materials) • Diffracted or scattered from an ordered crystal (X-Ray Diffraction – used to study crystal structure) • Cause the generation of X-rays of different “colors” (X-Ray Fluorescence– used to determine elemental composition) http://www.seawayort.com/hand.htm http://commons.wikimedia.org/wiki/File:X-ray_diffraction_pattern_3clpro.jpg
ATOMIC STRUCTURE • An atom consists of a nucleus (protons and neutrons) and electrons • Z is used to represent the atomic number of an element (the number of protons and electrons) • Electrons spin in shells at specific distances from the nucleus • Electrons take on discrete (quantized) energy levels (cannot occupy levels between shells • Inner shell electrons are bound more tightly and are harder to remove from the atom Adapted from Thermo Scientific Quant’X EDXRF training manual
ELECTRON SHELLS Shells have specific names (i.e., K, L, M) and only hold a certain number of electrons The shells are labelled from the nucleus outward K shell - 2 electrons L shell - 8 electrons M shell - 18 electrons N shell - 32 electrons X-rays typically affect only inner shell (K, L) electrons Adapted from Thermo Scientific Quant’X EDXRF training manual
MOVING ELECTRONS TO/FROM SHELLS Binding Energy versus Potential Energy • The K shell has the highest binding energy and hence it takes more energy to remove an electron from a K shell (i.e., high energy X-ray) compared to an L shell (i.e., lower energy X-ray) • The N shell has the highest potential energy and hence an electron falling from the N shell to the K shell would release more energy (i.e., higher energy X-ray) compared to an L shell (i.e., lower energy X-ray) Adapted from Thermo Scientific Quant’X EDXRF training manual
XRF – A PHYSICAL DESCRIPTION Step 1: When an X-ray photon of sufficient energy strikes an atom, it dislodges an electron from one of its inner shells (K in this case) Step 2a: The atom fills the vacant K shell with an electron from the L shell; as the electron drops to the lower energy state, excess energy is released as a K X-ray Step 2b: The atom fills the vacant K shell with an electron from the M shell; as the electron drops to the lower energy state, excess energy is released as a K X-ray Step 1: Step 2b: Step 2a: http://www.niton.com/images/XRF-Excitation-Model.gif
XRF – SAMPLE ANALYSIS http://www.niton.com/images/fluorescence-metal-sample.gif • Since the electronic energy levels for each element aredifferent, the energy of X-ray fluorescence peak can be correlated to a specific element
SIMPLE XRF SPECTRUM~10% As in Chinese supplement • The presence of As in this sample is confirmed through observation of two peaks centered at energies very close (within ±0.05 keV) to their tabulated (reference) line energies • These same two peaks will appear in XRF spectra of different arsenic-based materials (i.e., arsenic trioxide, arsenobetaine, etc.)
SIMPLE XRF SPECTRUM~10% Pb in imported Mexican tableware • The presence of Pb in this sample is confirmed through observation of two peaks centered at energies very close (within ±0.05 keV) to their tabulated (reference) line energies • These same two peaks will appear in XRF spectra of different lead-based materials (i.e., lead arsenate, tetraethyl lead,etc.)
BOX DIAGRAM OF XRF INSTRUMENT X-ray Source XRF Spectrum (cps vs keV) Results (elements and conc’s) Digital Pulse Processor Detector software Sample • X-ray tube source High energy electrons fired at anode (usually made from Ag or Rh) Can vary excitation energy from 15-50 kV and current from 10-200 A Can use filters to tailor source profile for lower detection limits • Silicon Drift Detector (SDD) and digital pulse processor Energy-dispersive multi-channelanalyzer – no monochromator needed, Peltier-cooled solid state detector monitors both the energy and number of photons over a preset measurement time The energy of photon in keV is related to the type of element The emission rate (cps) is related to the concentration of that element • Analyzer software converts spectral data to direct readout ofresults Concentration of an element determined from factory calibration data, sample thickness as estimated from source backscatter, and other parameters
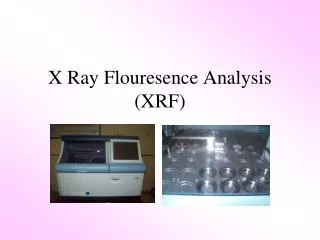
DIFFERENT TYPES OF XRF INSTRUMENTS Benchtop/Lab model/ Portable/ Handheld/ Bruker Tracer V http://www.brukeraxs.com/ Thermo/ARL Quant’X http://www.thermo.com/ Innov-X X-50 http://www.innovx.com/ • EASY TO USE (“point and shoot”) • Used for SCREENING • Can give ACCURATE RESULTS when used by a knowledgeable operator • Primary focus of these materials • COMPLEX SOFTWARE • Used in LAB ANALYSIS • Designed to give ACCURATE RESULTS (autosampler, optimized excitation, report generation)
OUTLINE 1. INTRODUCTION The electromagnetic spectrum and X-rays Basic theory of XRF and simple XRF spectra Different types of XRF instruments 2. INTERPRETATION OF XRF SPECTRA XRF spectra of different elements Limited resolution and overlapping peaks Artifact peaks 3. QUALITATIVE AND QUANTITATIVE ANALYSIS Confirmation of detection of an element Different calibration models Example calibration curves 4. APPLICATIONS OF XRF Screening for toxic elements in large numbers of samples Accurate quantitative analysis of target elements in various matrices 5. CONCLUSIONS XRF advantages and limitations References and additional reading
XRF SPECTRA Consecutive elements in periodic table • Plotting only a portion of the XRF spectra of several different elements • Note periodicity - energy is proportional to Z2 (Moseley’s law)
PERIODIC TABLE OF XRF FLUORESCENCE DATA Including K and L line energies & detection limits Adapted from Innov-X handout for handheld XRF analyzers Note similar reference tables available from other XRF vendors
XRF ENERGIES FOR VARIOUS ELEMENTS Generalizations based on use of field portable analyzers • ORGANIC ELEMENTS (i.e., H, C, N, O) DO NOT GIVE XRF PEAKS Fluorescence photons from these elements are too low in energy to be transmitted through air and are not efficiently detected using conventional Si-based detectors • LOW Z ELEMENTS (i.e., Cl, Ar, K, Ca) GIVE ONLY K PEAKS L peaks from these elements are too low in energy (these photons are not transmitted through air and not detected with conventional Si-based detectors) • HIGH Z ELEMENTS (i.e., Ba, Hg, Pb, U) GIVE ONLY L LINES K peaks from these elements are too high in energy (these electrons have high binding energies and cannot be removed with the limited voltage available in field portable analyzers) • MIDDLE Z ELEMENTS(i.e., Rh through I)MAY GIVE BOTH K AND L LINES
XRF – MORE DETAILED DESCRIPTION Note energy level diagrams are not drawn to scale As Pb ∞ ∞ 4s2p3d10f14 N 4s2p3d10f14 N L12.55 keV M M 3s2p3d10 3s2p3d10 K11.73 keV L10.61 keV As Pb L 2s2p6 L 2s2p6 >15.21 keV (absorption edge) K10.53 keV K 1s2 K 1s2 >11.86 keV (absorption edge - minimum amount of energy needed to remove electron) http://www.niton.com/images/fluorescence-metal-sample.gif • Since XRF affects inner shell and not bonding electrons, the XRF spectrum of an element is independent of its chemical form (i.e., spectra of lead, lead arsenate, and tetraethyl lead will ALL show peaks at 10.61 and 12.55 keV)
K LINE SERIES~10% As in Chinese supplement • L lines not observed (1.28 and 1.32 keV - too low in energy to be excited) • K and K peak energies are often close together (1.2 keV apart for As) • K lines observed for low to medium Z elements (i.e., Cl, Fe, As) • K and K peaks have typical ratio of ~ 5 to 1
L LINE SERIES~10% Pb in imported Mexican tableware Pb L line • K lines not observed (75.0 and 94.9 keV - too high in energy to be excited) • L and L peak energies are often further apart (2.1 keV apart for Pb) • L lines observed for high Z elements (i.e., Hg, Pb, Th) • L and L peaks have typical ratio of ~ 1 to 1
MORE COMPLEX XRF SPECTRUMChinese supplement containing 4% As and 2% Hg • Line overlaps are possible and users must evaluate spectrum to confirm the presence or absence of an element
EFFECT OF DETECTOR RESOLUTION Spectra of 900 ppm Pb added into Pepto-Bismol Newer SDD Older Si(PIN) detector Bi L line 10.84 keV Bi L line 10.84 keV Bi Bi Bi L line 13.02 keV Bi L line 13.02 keV Bi Bi Pb L line 10.55 keV Pb L line 12.61 keV Pb L line 10.55 keV Pb L line 12.61 keV Bi Bi Bi • Resolution ~0.2 keV (FWHM) • Cannot resolve Pb and Bi peaks • Resolution ~0.15 keV (FWHM) • Can resolve Pb and Bi peaks Adapted from Bruce Kaiser, Bruker AXS
ARTIFACT PEAKS Arising from X-ray tube source • Electrons with high kinetic energy (typically 10-50 kV) strike atoms in the X-ray tube source target (typically Rh or Ag) and transfer energy • The interaction of X-ray source photons with the sample generates several characteristic features in an XRF spectrum which may include the following: • Bremsstrahlung • Rayleigh peaks • Compton peaks
BREMSSTRAHLUNG Continuum/backscatter from cellulose sample E0 > Bremsstrahlung Adapted from Thermo Scientific Quant’X EDXRF training manual E0 = initial energy of electron in X-ray tube source E1 , E2 = energy of X-ray • Very broad peak due to backscattering of X-rays from sample to detector that may appear in all XRF spectra • Maximum energy of this peak limited by kV applied to X-Ray tube, maximum intensity of this peak is ~ 2/3 of the applied keV • More prominent in XRF spectra of less dense samples which scatter more of X-ray source photons back to the detector
RAYLEIGH PEAKS Elastic scattering from metal alloy sample Cr, Fe, Ni peaks from metal sample Rayleigh Peaks (Rh L and L lines) Adapted from Thermo Scientific Quant’X EDXRF training manual E0 = initial energy of X-ray from target element in x-ray tube source E1 = energy of X-ray elastically scattered from (typically dense) sample • Peaks arising from target anode in X-ray tube source (Rh in this case) that may appear in all XRF spectra acquired on that instrument • No energy is lost in this process so peaks show up at characteristic X-ray energies (Rh L and L at 20.22 and 22.72 keV in this case) • Typically observed in spectra of dense samples as weak peaks (due to increased absorption of X-ray source photons by sample)
COMPTON PEAKS Inelastic scattering from cellulose sample Compton Peaks (E’s < Rh L and L lines ) PHOTO ELECTRON Rayleigh Peaks (Rh L and L lines) Adapted from Thermo Scientific Quant’X EDXRF training manual E0 = initial energy of X-ray from target element in x-ray tube source E1 = energy of X-ray inelastically scattered from (typically non-dense) sample • Peaks arising from target element in X ray tube (again, Rh in this case) that may appear in all XRF spectra acquired on that instrument • Some energy is lost in this process so peaks show up at energies slightly less than characteristic X-ray tube target energies • Typically observed in spectra of low density samples as fairly intense peaks (note these peaks are wider than Rayleigh peaks)
ARTIFACT PEAKS Arising from detection process • The interaction of X-ray fluorescence photons from the sample with the detector can generate several different types of artifact peaks in an XRF spectrum which may include the following: • Sum peaks • Escape peaks
SUM PEAKS Example from analysis of Fe sample Detector Fe K peak 6.40 keV Fe Kphoton 6.40 keV Sum peak 12.80 keV Fe Kphoton 6.40 keV Sum Peak=Fe + Fe 12.80 = 6.40 + 6.40 Fe sum peak 12.80 keV Adapted from Thermo Scientific Quant’X EDXRF training manual • Artifact peak due to the arrival of 2 photons at the detector at exactly the same time (i.e., K + K, K + K) • More prominent in XRF spectra that have high concentrations of an element • Can be reduced by keeping count rates low
ESCAPE PEAKS Example from analysis of Pb sample Detector Si K photon 1.74 keV Pb escape peak (from L) Escape peak 8.81 keV Pb L photon 10.55 keV Pb escape peak (from L) Escape Peak=Pb– Si 8.81 =10.55–1.74 Adapted from Thermo Scientific Quant’X EDXRF training manual • Artifact peak due to the absorption of some of the energy of a photon by Si atoms in the detector (Eobserved = Eincident – ESi where ESi = 1.74 keV) • More prominent in XRF spectra that have high concentrations of an element and for lower Z elements • Can be reduced by keeping count rates low
ARTIFACT PEAKS DUE TO BLANK MEDIA Artifact Peaks (Fe, Cu, Zn) • May observe peaks due to contaminants in XRF cups, Mylar film, and matrix • In this case, the cellulose matrix is highly pure and the peaks are due to trace elements in the XRF analyzer window and detector materials • This can complicate interpretation (false positives)
SUMMARY OF FACTORS THAT COMPLICATE INTERPRETATION OF XRF SPECTRA • Elements in the sample may produce 2 or more lines • K, KL, L(we use simplified nomenclature and discussed only and lines) • L, L, L, L (can also have and lines, and lines, lines, etc.) Peak overlaps arising from the presence of multiple elements in the sample and limited detectorresolution Peaks from X-ray source • Bremsstrahlung (more prominent in less dense samples) • Rayleigh peaks from X-ray source target (typically Ag L, L) • Compton peaks from X-ray source target (typically at energies < Ag L, L) Sum peaks (two X-ray photons arriving at the detector at the same time) • E = K + K • E = K + K Escape peaks (Si in the detector absorbing some of the energy from a X-ray) • E = K – Kfor Si (where Si line energy = 1.74 keV) • E = L – Kfor Si Other artifact peaks • Product packaging, XRF cup, Mylar film, (measure what you want to measure) • Contaminants on XRF window or trace levels of elements in XRF window or detector materials (analyze blanks to confirm source of these artifacts)
OUTLINE 1. INTRODUCTION The electromagnetic spectrum and X-rays Basic theory of XRF and simple XRF spectra Different types of XRF instruments 2. INTERPRETATION OF XRF SPECTRA XRF spectra of different elements Limited resolution and overlapping peaks Artifact peaks 3. QUALITATIVE AND QUANTITATIVE ANALYSIS Confirmation of detection of an element Different calibration models Example calibration curves 4. APPLICATIONS OF XRF Screening for toxic elements in large numbers of samples Accurate quantitative analysis of target elements in various matrices 5. CONCLUSIONS XRF advantages and limitations References and additional reading
QUALITATIVE ANALYSISIssues to consider • Question: What is the GOAL of the analysis and WHAT ELEMENTS do we want to look for (toxic elements such as As, Cd, Hg, Pb; nutrient elements such as Ca, Fe)? • Answer: Define the problem (what to measure, typical concentration range, required detection limit, accuracy, precision, etc.) • Question: Are there any potentialSPECTRAL OVERLAPS with other elements in sample? • Answer: Compare line energies of target elements and other elements to identify any possible interferences • Question: If we get a “positive” (detection of a toxic element), do we know for certain that it is IN THE SAMPLE and not in the product packaging or the background materials used to hold the sample? • Answer: Measure what you want to measure and be sure to do “blanks” Question: How do we know that the analyzer software is not giving ERRONEOUS RESULTS(false positives or false negatives)? Answer: Users must evaluate the spectrum to verify the reported results – positive identification of an element requires observation of two peaks at energies close to their tabulated values
QUALITATIVE ANALYSIS Spectra for positive, tentative, and negative identifications • As and Hg clearly present in blue spectrum (see both and peaks) • As and Hg possibly present in purple spectrum ( peaks barely > blank) • As and Hg not present in black spectrum (no visible peaks)
QUALITATIVE ANALYSIS False positive for Pb in baby food cap Closeup of Pb lines Spectrum Fe sum peak 12.80 keV • User acquired sample spectrum near lid (>10% Fe), which gave Fe sum peak at 6.40 keV * 2 photons = 12.80 keV • Vendor algorithm incorrectly identified Pb in this sample at over 2000 ppm (detection and quantitation based on signal at the Pb L line at 12.61 keV, zero intensity of Pb L line at 10.55 keV not considered by algorithm) • Be wary of analyzer software and be sure to avoid potential false positives such as this by evaluating the spectrum to confirm the presence of an element
QUALITATIVE ANALYSISFalse negative for U in tableware • Vendor algorithm did not identify U in this sample(algorithm not intended to attempt this identification of this and other relatively uncommon elements) • Lack of manual interpretation of the spectrum of a product containing only U would have led to the assumption that it was safe • Be wary of analyzer software and be sure to avoid potential false negatives such as this by evaluating the spectrum to identify unexplained peaks
CONCLUSIONS ON QUALITATIVE ANALYSIS • Vendor software on commercial XRF analyzers are usually reliable in identifying which elements are present in a sample, but are not foolproof and an occasional false positive or false negative is possible FALSE POSITIVES (element detected when not present) • Due to limitations in the vendor software, which make not take into account line overlaps, sum peaks, escape peaks • Users must confirm positive detection of an element based on the observation of two peaks centered within ±0.05 keV of the tabulated line energies for that element at the proper intensity ratio (5:1 for K lines, 1:1 for L lines) FALSE NEGATIVES (element not detected when present) • Due to limitations in the analyzer software, which may not be set up to detect all possible elements in the periodic table • Unlikely occurrence for toxic elements such as As, Hg, Pb, and Se, more common for rare elements such as U, Th, and Os • Users must identify “non-detected” elements through manual interpretation of the spectrum
QUANTITATIVE ANALYSISIssues to consider Question: Are the element CONCENTRATIONS within the detection range of XRF (% to ppm levels)? Answer: Define the problem, research sample composition, or take a measurement Question: What sort of SAMPLE PREP is required (can samples be analyzed as is or do they need to be ground up)? Answer: Consider sample - is it homogeneous? Question: For SCREENING PRODUCTS, are semi-quantitative results good enough? For example, if percent levels of a toxic element are found in a supplement, is this sufficient evidence to detain it or to initiate a regulatory action? Question: For ACCURATE QUANTITATIVE ANALYSES, what is the most appropriate calibration model to use for the samples of interest (Compton Normalization, Fundamental Parameters, empirical calibration, standard additions)?
TYPES OF CALIBRATION MODELS • VISUAL OBSERVATION (rough approximation, depends on many variables) • Peak intensity >100 cps corresponds to concentrations >10,000 ppm (% levels) • Peak intensity of 10-100 cps corresponds to concentrations of ~100-1000 ppm • Peak intensity of 1-10 cps corresponds to concentrations ~10-100 ppm • Peak intensity < 1 cps corresponds to concentrations ~1-10 ppm FUNDAMENTAL PARAMETERS (aka FP or alloy mode) • Uses iterative approach to select element concentrations so that modeled spectrum best matches samples spectrum (using attenuation coefficients, absorption/enhancement effects, and other known information) • Best for samples containing elements that can be detected by XRF (i.e., alloys, well characterized samples, and samples containing relatively high concentrations of elements) COMPTON NORMALIZATION (aka CN or soil mode) • Uses “factory” calibration based on pure elements (i.e., Fe, As2O3) and ratioing the intensity of the peak for the element of interest to the source backscatter peak to account for differences in sample matrices, orientation, etc. • Best for samples that are relatively low density (i.e., consumer products, supplements) and samples containing relatively low concentrations of elements (i.e., soil) OTHER MODES – thin film/filters, RoHS/WEEE, pass/fail, etc. • Beyond scope of these training materials
TYPES OF CALIBRATION MODELS • EMPIRICAL CALIBRATION • Involves preparation of authentic standards of the element of interest in a matrix that closely approximates that of the samples • Provides more accurate results than factory calibration and Compton Normalization • Note that the XRF analyzer can be configured and used with this type of calibration to give more accurate results for the elements and matrices of interest • Usually reserved for laboratory analyses by trained analysts, using a high purity metal salt containing the element of interest, an appropriate matrix, homogenization via mixing or grinding STANDARD ADDITIONS • Involves adding known amounts of element of interest into the sample • Provides most accurate results as the standards are prepared in the sample matrix as the sample • Usually reserved for laboratory analyses by trained analysts, and even then used only as needed as this is labor intensive and time consuming
EFFECT OF CONCENTRATION Spectra of As standards in cellulose • Intensity is proportional to concentration • Detection limits depend on element, matrix, measurement time, etc. • Typical detection limits are as low as 1 part per million (ppm)
PEAK INTENSITY VS CONCENTRATIONLinearity falls off at high concentrations Se in yogurt • Response becomes nonlinear between 1000-10,000 ppm • Use of Compton Normalization will partially correct for this P.T. Palmer et al, DXC, 2008 (Se in yogurt, Innov-X alpha 2000)
COMPTON NORMALIZED INTENSITY VS CONC.Linearity improves through use of “internal standard” Se in yogurt • Use of Compton Normalization (X-ray tube source backscatter from sample) partially corrects for self absorption and varying sample density P.T. Palmer et al, DXC, 2008 (Se in yogurt, Innov-X alpha 2000)
QUANTITATIVE ANALYSIS AT HIGH CONC’SCr standards in stainless steel for medical instrument analysis FP mode with empirical calibration -2% error -3% error -7% error -11% error -5% error • Although Fundamental Parameters based quantitation gives fairly accurate results, it also gives determinate error (consistently negative errors) • Determination of Cr in surgical grade stainless steel samples using an XRF analyzer calibrated with these standards gave results that were statistically equivalent to flame atomic absorption spectrophotometry • For determining % levels of an element, use Fundamental Parameters mode
QUANTITATIVE ANALYSIS AT LOW CONC’SAs, Hg, Pb, and Se standards in cellulose for supplement analysis CN mode with empirical calibration 9% error 8% error 4% error • Although Compton Normalization based quantitation gives fairly accurate results, it can also give significant determinate error (slopes > 1) • Determination of Pb in supplements using an XRF analyzer calibrated with these standards gave results that were statistically equivalent to ICP-MS • For determining ppm levels of an element, use Compton Norm. mode
STANDARD ADDITIONS METHODDetermination of As in grapeseed sample • Typically gives more reliable quantitative results as this method involves matrix matching (the sample is “converted” into standards by adding known amounts of the element of interest) • This process is more time consuming (requires analysis of sample “as is” plus two or more samples to which known amounts of the element of interest have been added)
EFFECT OF MEASUREMENT TIMELonger analysis times give better precision and lower LODs Results from analysis of 100 ppm Pb Long measurement times give ↑S/N and ↓LODs but provide diminishing returns in precision (%RSD can be misleading as precision unrelated to accuracy) Short measurement times - poor statistics/precision • S/N = mean signal / standard deviation of instrument response (noise) • As per theory, S/N is proportional to square root of measurement time • 1-2 min measurement gives a good compromise between speed and precision • Longer measurement times give better S/N and lower LODs
CONCLUSIONS ON QUANTITATIVE ANALYSIS • For field applications, the sample is often analyzed “as is” and some accuracy is sacrificed in the interest of shorter analysis times and higher sample throughput, as the more important issue here is sample triage (identifying potential samples of interest for more detailed lab analysis) • Use FP mode to analyze samples that contain % levels of elements • Use CN mode to analyze samples that contain ppm levels of elements and have varying densities For lab applications, more accurate quantitative results are obtained by an empirical calibration process • Grind/homogenize product to ensure a representative sample • Calibrate the analyzer using standards and/or SRMs • Use a calibration curve to compute concentrations in samples • When suitable standards are not available or cannot be readily prepared, consider using the method of standard additions For either mode of operation, getting an accurate number involves much more work than implied in the “point and shoot” marketing hype of some XRF manufacturers