Download
1 / 26
260 likes | 404 Views
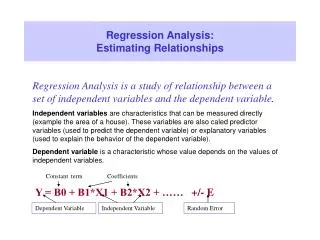
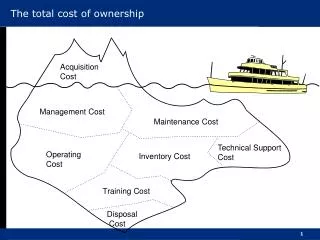
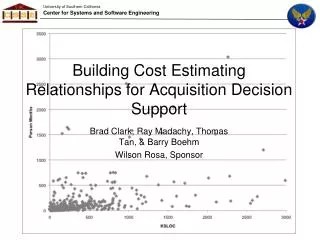
Building Cost Estimating Relationships for Acquisition Decision Support. Brad Clark, Ray Madachy, Thomas Tan, & Barry Boehm Wilson Rosa, Sponsor. Topics. Research problem and objectives Data challenges and resolution Results Future work.

E N D
Building Cost Estimating Relationships for Acquisition Decision Support Brad Clark, Ray Madachy, Thomas Tan, & Barry Boehm Wilson Rosa, Sponsor
Topics • Research problem and objectives • Data challenges and resolution • Results • Future work Project led by the Air Force Cost Analysis Agency (AFCAA) working with service cost agencies, and assisted by University of Southern California and Naval Postgraduate School 25th International Forum on COCOMO and Systems/Software Cost Modeling 2
Problem • For many years, there have been efforts to collect data from multiple projects and organizations • Data Analysis Center for Software (DACS) • Software Engineering Information Repository (SEIR) • International Software Benchmarking Standards Group (ISBSG) • Large Aerospace Mergers (Attempts to create company-wide databases) • USAF Mosemann Initiative (Lloyd Mosemann Asst. Sec. USAF) • USC CSSE COCOMO II repository • DoD Software Resources Data Report (SRDR) • Purpose: to derive estimating relationships and benchmarks for size, cost, productivity and quality • All have faced common challenges such as data definitions, completeness and integrity 25th International Forum on COCOMO and Systems/Software Cost Modeling
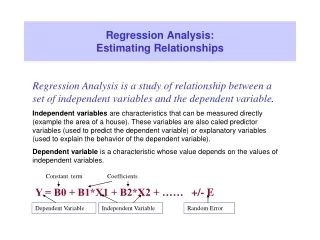
Research Objectives • Using SRDR data, improve the quality and consistency of estimating methods across cost agencies and program offices through guidance, standardization, and knowledge sharing. • Characterize different Application Domains and Operating Environments within DoD • Analyze collected data for simple Cost Estimating Relationships (CER) within each domain • Develop rules-of-thumb for missing data • Make collected data useful to oversight and management entities Data Analysis Cost = a * Xb Data Records CERs 25th International Forum on COCOMO and Systems/Software Cost Modeling
SRDR Raw Data (520 observations) PM = 1.67 * KSLOC0.66 25th International Forum on COCOMO and Systems/Software Cost Modeling
Data Conditioning • Segregate data • Normalize sizing data (predictor) • Normalize effort data (response) • Address multi-build data 25th International Forum on COCOMO and Systems/Software Cost Modeling
SRDR Data Segmentation 25th International Forum on COCOMO and Systems/Software Cost Modeling 7
Communication Domain Analysis-1 25th International Forum on COCOMO and Systems/Software Cost Modeling
Mission Management Analysis-1 25th International Forum on COCOMO and Systems/Software Cost Modeling
Normalizing Size • Normalize the SLOC counting method to Logical SLOC • Physical SLOC count converted to Logical SLOC count by programming language • Non-comment SLOC count converted to Logical SLOC count by programming language • Convert Auto-Generated SLOC convert to Equivalent SLOC (ESLOC) • Use AAF formula: (DM% * 0.4) + (CM% * 0.3) + (IM% * 0.3) • DM = CM = 0; IM = 100 • Convert Reused SLOC to ESLOC with AAF formula • DM = CM = 0; IM = 100 • Convert Modified SLOC to ESLOC • Use AAF formula: (DM% * 0.4) + (CM% * 0.3) + (IM% * 0.3 • Default values: Low – Mean – High based on 90% confidence interval • Create Equivalent SLOC count and scale to thousands (K) to derive EKSLOC • (New + Auto-Gen+ Reused+ Modifed) / 1000 = EKSLOC • Remove all records with an EKSLOC below 1.0 25th International Forum on COCOMO and Systems/Software Cost Modeling
SLOC Count Conversion Experiment Logical SLOC = 0.611 * NCSS Count R2 = 0.9974 25th International Forum on COCOMO and Systems/Software Cost Modeling 11
SLOC Count Conversion Factors For example, (C++ NCSS SLOC Count) * 0.61 = (C++ Logical SLOC Count) 25th International Forum on COCOMO and Systems/Software Cost Modeling 12
Convert Modified Size to ESLOC • Use AAF formula: (DM% * 0.4) + (CM% * 0.3) + (IM% * 0.3) • Problems with missing DM, CM & IM in SRDR data • Program interviews provided parameters for some records • For missing data, use records that have data in all fields to derive recommended values for missing data 25th International Forum on COCOMO and Systems/Software Cost Modeling 13
Convert Modified Size to ESLOC • Communication Domain (18 observations) • Mission Management (19 observations) 25th International Forum on COCOMO and Systems/Software Cost Modeling 14
Normalizing Effort • Labor hours are reported for 7 categories: • Software Requirements • Software Architecture (including Detailed Design) • Software Code (including Unit Testing) • Software Integration and Test • Software Qualification Test • Software Developmental Test & Evaluation • Other (Mgt, QA, CM, PI, etc.) • Create effort distribution percentages for records that have hours in requirements, architecture, code, integration and qualification test phases (developmental test evaluation and other phases may or may not be blank) • Fill in missing hours using effort distribution table • Currently don’t use Developmental Test and Other hours 25th International Forum on COCOMO and Systems/Software Cost Modeling
Distribution Percentages • Communication (27 observations) • Mission Management (16 observations) 25th International Forum on COCOMO and Systems/Software Cost Modeling
Multi-Build Data 25th International Forum on COCOMO and Systems/Software Cost Modeling
One More: Team Experience • SRDR Data Definition • Report the percentage of project personnel in each category • Highly Experienced in the domain (three or more years of experience) • Nominally Experienced in the project domain (one to three years of experience) • Entry-level Experienced (zero to one year of experience) • Need to include Team Experience (TXP) in CERs to estimate cost • After analyzing the data, the following quantitative values are assigned: • Highly experienced: 0.60 • Nominally experienced: 1.00 • Entry-level experienced: 1.30 25th International Forum on COCOMO and Systems/Software Cost Modeling
Data Conditioning Results Just Kidding! 25th International Forum on COCOMO and Systems/Software Cost Modeling
Five Phases PM = 6.35 * EKSLOC0.939 R2 = 0.86 25th International Forum on COCOMO and Systems/Software Cost Modeling 20
Three Phases PM = 3.8 * EKSLOC0.953 R2 = 0.88 25th International Forum on COCOMO and Systems/Software Cost Modeling
Five Phases PM = 5.06 * EKSLOC1.22 R2 = 0.890 25th International Forum on COCOMO and Systems/Software Cost Modeling
Three Phases PM = 3.47 * EKSLOC1.19 R2 = 0.9094 25th International Forum on COCOMO and Systems/Software Cost Modeling
Simple Cost Estimating Relationships Notes: CER: Cost Estimating Relationship PM: Person Months (152 labor hours / month) EKSLOC: Equivalent Thousands of Source Lines of Code R2: Correlation Coefficient that ranges for 0 to 1 Bias: Average percentage error that estimate is above/below actual value 25th International Forum on COCOMO and Systems/Software Cost Modeling 24
Conclusion • Workshop: Thursday from 8:00 AM to 2:50 PM • Come find out • How to use the information to construct an estimate • Next steps and schedule • Conclusions about this approach • Discussion on how the SRDR may change • We made recommendations for improvements • We will also discuss ranking Application Domains by order of productivity 25th International Forum on COCOMO and Systems/Software Cost Modeling
Questions? For more information, contact: Wilson Rosa Wilson.Rosa@pentagon.af.mil 703-604-0395 Or Brad Clark bkclark@csse.usc.edu 703-754-0115 Or Ray Madachy rjmadach@nps.edu 25th International Forum on COCOMO and Systems/Software Cost Modeling 26