Download
1 / 22
220 likes | 304 Views
Explore relationships between water content and reflectance in conifer needles, assessing various indices. Study paves way for aerial imaging of water status. Findings relate spectral indices to water content and potential.

E N D
Spectral sensing of foliar water conditions in conifer needles Hugh Stimson1, David Breshears2, Shawn Kefauver1, Susan Ustin1 1 University of California, Davis 2 Los Alamos National Laboratory Ecological Society of America Annual Meeting, Savannah Georgia USA, August 7th 2003
goals • find relationships between water and reflectance at the needle level • assess a suite of reflectance indices • lay groundwork for pending aerial imaging of water status
protocol • sample gradient • 17 trees selected • selected from visual estimate for wide water range • water content • 3 twigs per sample • 1st whorl of needles removed • weighed, dried to constant weight, reweighed • water potential • N = 15 • average of 2 twigs per tree • measured in pressure bomb
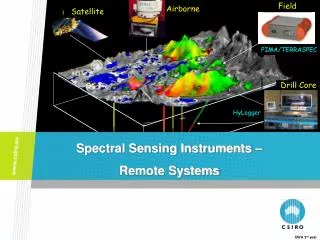
protocol • spectral reflectance • same 3 twigs as water content • subset of needles removed, racked onto vinyl mounts • measured with ASD full-range field spectrometer via Licor integrating sphere • Measured within 15 minutes of fridge, 5 of instrument calibration • integration time 10s
analysis direct water measurements v. spectral indices 980nm water absorption 1200nm water absorption normalized differential water index normalized differential vegetation index Water content (% foliar mass) Water potential (MPa)
analysis 970nm
analysis 1200nm
analysis 860-1240 860+1240 NDWI
analysis 880-660 880+660 NDVI
analysis 970nm 1200nm NDVI NDWI
results spectral indices v. water content 970 nm NDWI R2=0.91 p<0.001 R2=0.96 p<0.001 1200 nm NDVI R2=0.59 p<0.001 R2=0.93 p<0.001 foliar water content (%mass)
results spectral indices v. water potential 970 nm R2=0.37 p=0.03 NDWI R2=0.45 p=0.006 1200 nm NDVI R2=0.03 p=0.5 R2=0.35 p=0.02 water potential (|MPa|)
results • The foliar water content of Piñon pine needles can be reliably predicted from their reflectance. • A weaker, indirect, relationship exists between water potential and reflectance. • The most robust measure is NDWI, closely followed by NDVI and 970nm absorption.