Download
1 / 27
320 likes | 579 Views
Remote Sensing of Water. Cryosphere and MRR Update Spectral Properties of Water Measuring Chlorophyll Content Sea Surface Temperature ENSO Discussion For Next Class: Read Chapter 12 (pp. 428-435). Cryosphere Update. http://arctic.atmos.uiuc.edu/cryosphere/

E N D
Remote Sensing of Water • Cryosphere and MRR Update • Spectral Properties of Water • Measuring Chlorophyll Content • Sea Surface Temperature • ENSO Discussion For Next Class: Read Chapter 12 (pp. 428-435)
Cryosphere Update • http://arctic.atmos.uiuc.edu/cryosphere/ • http://ice-glaces.ec.gc.ca/App/WsvPageDsp.cfm?ID=1&Lang=eng
Absorption and Scattering Attenuation in Pure Water Scattering in the water column is important in the violet, dark blue, and light blue portions of the spectrum (400 - 500 nm). This is the reason water appears blue to our eyes. The graph truncates the absorption data in the ultraviolet and in the yellow through near-infrared regions because the attenuation is so great. Jensen, 2000
Water Penetration Cozumel Island Palancar Reef Caribbean Sea SPOT Band 1 (0.5 - 0.59 mm) green SPOT Band 2 (0.61 - 0.68 mm) red SPOT Band 3 (0.79 - 0.89 mm) NIR Jensen, 2000
Percent reflectance of clear and algae-laden water based on in situ spectroradiometer measurement. Note the strong chlorophyll a absorption of blue light between 400 and 500 nm and strong chlorophyll a absorption of red light at approximately 675 nm Percent Reflectance Percent reflectance of algae-laden water with various concentrations of suspended sediment ranging from 0 - 500 mg/l Percent Reflectance Han, 1997; Jensen, 2000
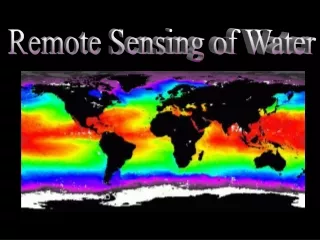
Global Chlorophyll a (g/m3) Derived from SeaWiFS Imagery Obtained from September 3, 1997 through December 31, 1997 Jensen, 2000
Chlorophyll a distribution on September 30, 1997 derived from SeaWiFS data True-color SeaWiFS image of the Eastern U.S. on September 30, 1997 Jensen, 2000
Sea-surface Temperature (SST) Maps Derived from A Three-day Composite of NOAA AVHRR Infrared Data Centered on March 4, 1999 Adjusted to highlight nearshore temperature differences Adjusted to highlight Gulf Stream temperature differences Jensen, 2000
Composite Sea-surface Temperature (SST) Map of the Southeastern Bight Derived from AVHRR Data Jensen, 2000
Worldwide Sea-surface Temperature (SST) Map Derived From NOAA-14 AVHRR Data Three-day composite of thermal infrared data centered on March 4, 1999. Each pixel was allocated the highest surface temperature that occurred during the three days. Jensen, 2000
Reynolds Monthly Sea-surface Temperature (˚C) Maps Derived from In situ Buoy and Remotely Sensed Data La Niña December, 1988 Normal December, 1990 El Niño December, 1997 Jensen, 2000
ENSO Animations • http://www.cpc.ncep.noaa.gov/products/precip/CWlink/MJO/enso.shtml • http://nsipp.gsfc.nasa.gov/enso/visualizations/
ENSO Links • http://www.cpc.ncep.noaa.gov/products/analysis_monitoring/enso_update/sstanim.shtml • http://www.cpc.ncep.noaa.gov/products/analysis_monitoring/enso_advisory/ensodisc.html • http://www.noaanews.noaa.gov/stories2009/20091015_winteroutlook.html
1982-83 El Niño 1997-98 El Niño 1998-99 La Niña