Chapter 5a Process Capability
Chapter 5a Process Capability. This chapter introduces the topic of process capability studies. The theory behind process capability and the calculation of Cp and Cpk is presented. Specification Limit & Process Limit. Look at indv. values and avg. values of x’s

Chapter 5a Process Capability
E N D
Presentation Transcript
Chapter 5a Process Capability This chapter introduces the topic of process capability studies. The theory behind process capability and the calculation of Cp and Cpk is presented
Specification Limit &Process Limit • Look at indv. values and avg. values of x’s • Indv x’s values n = 84 - considered as population • Avg’s n = 21 - sample taken = same (in this case) • Normally distributed individual x’s and avg. values having same mean, only the spread is different > • Relationship = popu. Std. dev. of avg’s • If n = 5 = 0.45 = popn std dev of indiv. x’s • SPREAD OF AVGS IS HALF OF SPREAD FOR INDV. VALUES
Relationship between population and sample values • Assume Normal Dist. • ‘Estimate’ popu. std. dev. • c4 ; n = 84 • (c4 = 0.99699) = 4.17 = 2.09
Central Limit Theorem • ‘If the population from which samples are taken is NOT normal, the distribution of SAMPLE AVERAGES will tend toward normality provided that sample size, n, is at least 4.’ • Tendency gets better as n • Standardized normal for distribution of averages Z =
Central Limit Theorem is one reason why control chart works • No need to worry about distribution of x’s is not normal, i.e. indv. values. • Averages distribution will tend to ND
Control Limits & Specifications • Control limits - limits for avg’s, and established as a func. of avg’s • Specification limits - allowable variation in size as per design documents e.g. drawing • for individual values • estimated by design engineers
Control limits, Process spread, Dist of averages, & distribution of individual values are interdependent. – determined by the process • C. Charts CANNOT determine process meets spec.
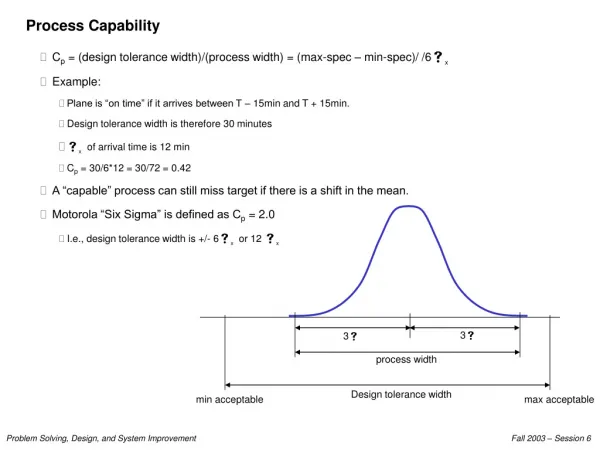
Process Capability & Tolerance • When spec. established without knowing whether process capable of meeting it or not serious situations can result • Process capable or not – actually looking at process spread, which is called process capability (6) • Let’s define specification limit as tolerance (T) : T = USL -LSL • 3 types of situation can result the value of 6 < USL-LSL the value of 6 = USL - LSL the value of 6 > USL - LSL
Process Capability • Procedure (s – method) • Take subgroup size 4 for 20 subgroups • Calculate sample s.d., s, for each subgroup • Calculate avg. sample s.d. s= s/g • Calculate est. population s.d. • Calculate Process Capability = • R - method • Same as 1. above • Calculate R for each subgroup • Calculate avg. Range, = R/g • Calculate • Calculate Calculate 6
Cp - Capability Index T = U-L Cp = 1 Case II 6 = T Cp > 1 Case I 6 < T Cp < 1 Case III 6 > T Usually Cp = 1.33 (de facto std.) Measure of process performance Shortfall of Cp - measure not in terms of nominal or target value >>> must use Cpk Formulas Cp = (T)/6 Cpk = Process Capability (6) And Tolerance Z (USL) = Z (LSL) =
Determine Cp and Cpk for a process with average 6.45, = 0.030, having USL = 6.50 , LSL = 6.30 -- T = 0.2 Solution Cp= T/6= 0.2/6(0.03)=1.11 Cpk = Z(min)/3 Z(U) = (USL -x)/ = 6.50-6.45)/0.03 = 1.67 Z(L) = (x –LSL)/ = 6.45-6.30)/0.03 = 5.00 Cpk = 1.67/3 = 0.56 Process NOT capable since not centered. Cp > 1 doesn’t mean capable. Have to check Cpk L U T 6.50 6.45 = 6.30 Example
Comments On Cp, Cpk • Cp does not change when process center (avg.) changes • Cp = Cpk when process is centred • Cpk Cp always this situation • Cpk = 1.00 de facto standard • Cpk < 1.00 process producing rejects • Cp < 1.00 process not capable • Cpk = 0 process center is at one of spec. limit (U or L) • Cpk < 0 i.e. – ve value, avg outside of limits
Find Cp, Cpk x = 129.7 (Length of radiator hose) = 2.35 Spec. 130.0 3.0 What is the % defective? Find Cp, Cpk Spec.U = 58 mm L = 42 mm = 2 mm When = 50 When = 54 Find Cp, Cpk U = 56 L = 44 = 2 When = 50 When = 56 Exercise