Download
1 / 22
220 likes | 254 Views
This study explores the potential of VEGFR-3 as a novel target to enhance net ultrafiltration in methylglyoxal-induced peritoneal injury. Utilizing soluble VEGFR-3-Ig and a VEGFR-3 kinase inhibitor, the inhibition mechanisms are investigated. Experimental designs include the development of injury models in mice and inhibition studies using adenovirus-mediated gene expression. Evaluation involves peritoneal equilibration tests and peritoneal lavage to assess peritoneal functions. Results indicate a promising role for VEGFR-3 inhibition in mitigating peritoneal injury.

E N D
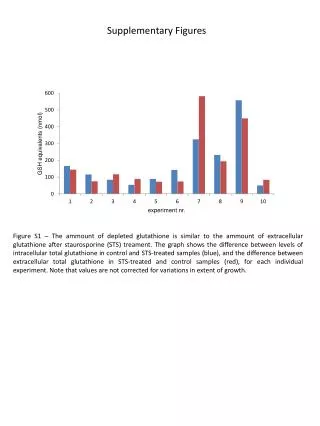
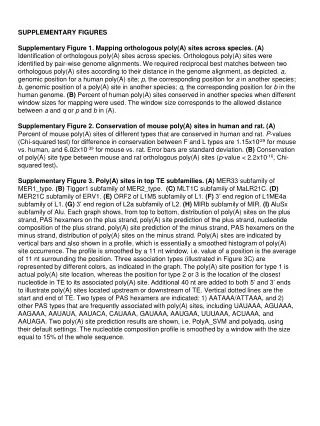
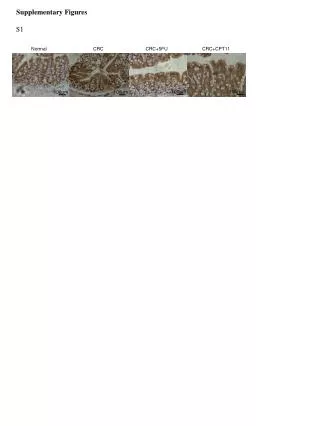
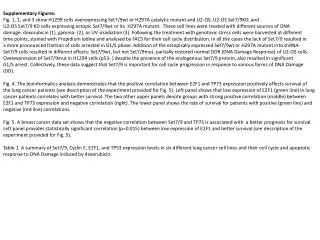
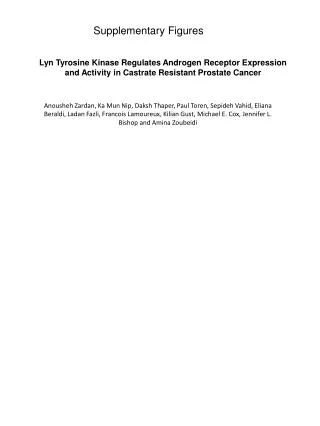
Supplementary Figures , Tables and information Supplementary Figures 1-14 Supplementary Tables 1-2 Supplementary information 1 Vascular endothelial growth factor receptor-3 is a novel target to improve net ultrafiltration in methylglyoxal-induced peritoneal injury Takeshi TerabayashiMD 1, Yasuhiko ItoMD, PhD 1, Masashi Mizuno MD, PhD 1, Yasuhiro Suzuki MD, PhD 1, Hiroshi Kinashi MD, PhD 1, Fumiko Sakata MD 1, Takako Tomita MD 1, Daiki Iguchi MD 1, Mitsuhiro Tawada MD 1, Ryosuke Nishio MD, PhD 2, Shoichi Maruyama MD, PhD 1, Enyu Imai MD, PhD 1, 3, Seiichi Matsuo MD, PhD 1, and Yoshifumi Takei PhD 4 Department of 1Nephrology and Renal Replacement Therapy and 4Biochemistry, Nagoya University Graduate School of Medicine, Nagoya, Japan 2Department of Emergency Medicine, Kyoto University Hospital, Kyoto, Japan 3Nakayamadera Imai Clinic, Takarazuka, Japan
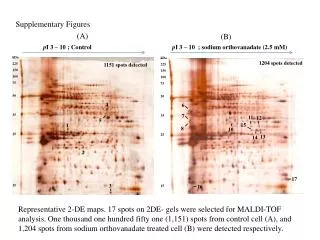
VEGF-C VEGF-D soluble-VEGFR3-Ig MAZ51 extracellular domain P P TK TK TK cytoplasmic domain TK VEGFR-3 Lymphangiogenesis Supplementary Figure 1. Schematic diagram of the inhibition of VEGFR-3 activation by soluble VEGFR-3 or by a VEGFR-3 kinase inhibitor. A schematic diagram showing two different mechanisms of inhibition of VEGFR-3 activation. A soluble VEGFR-3-immunoglobulin (Ig) G Fc-domain fusion protein acts as a decoy receptor and traps VEGF-C/-D that bind to the extracellular domain of VEGFR-3 (Tammela T et al., Cell 2010; 140: 460-476). The VEGFR-3 kinase inhibitor, 4-dimethylamino-naphthalene-1-carbaldehyde (MAZ51), has been reported to specifically inhibit VEGF-C/-D induced VEGFR-3 auto-phosphorylation (Kirkin V et al., Eur J Biochem 2001; 268: 5530-40). TK: tyrosine kinase domain. Supplementary Figure 1
a Experiment 1 methylglyoxal model Tissue Sampling PDF with methylglyoxal 5 consecutive days / week Day 1 8 15 22 Control Tissue Sampling PDF without methylglyoxal 5 consecutive days / week PET Tissue Blood Sampling Day 1 8 15 22 b Experiment 2 sVEGFR3-Ig LacZ AdV 1.0x10⁹ p.f.u./ animal PDF with methylglyoxal 5 consecutive days / week Day 0 1 8 15 22 PDF: peritoneal dialysis fluid PET: peritoneal equilibration test Supplementary Figure 2 - 1
c Experiment 3 PDF with methylglyoxal 5 consecutive days / week Day 1 8 15 21 Sacrificed Peritoneal rest No administration of PDF PET 22 29 36 43 50 Tissue Blood Sampling d Experiment 4 PDF with methylglyoxal 5 consecutive days / week sVEGFR3-Ig LacZ AdV 1.0x10⁹ p.f.u./ animal Day 0 1 8 15 21 1.5 % glucose based PDF 5 consecutive days / week 22 29 36 43 50 PDF: peritoneal dialysis fluid PET: peritoneal equilibration test Supplementary Figure 2 - 2
Supplementary Figure 2. Experimental design and protocols. a:Experiment 1. Development of methylglyoxal induced peritoneal injury model in mice b: Experiment 2. Inhibition studies using an adenovirus expressing sVEGFR-3 and a control adenovirus expressing Lac Z in methylglyoxal-induced peritoneal injury models. The models were assessed using a traditional peritoneal equilibration test with a 4.25% glucose-based peritoneal dialysis fluid and a peritoneal equilibration test with 7.5% icodextrin on day 22. c: Experiment 3. Development of a methylglyoxal-induced peritoneal injury model with peritoneal rest from day 22 to day 50. In these mice, dialysate was not infused into the peritoneal cavity duringthe peritoneal rest. d: Experiment 4. Inhibition studies using adenovirus expressing sVEGFR-3 and control adenovirus expressing Lac Z, in a methylglyoxal model as in (b) except that the mice further underwent peritoneal lavage using a 1.5% peritoneal dialysis fluid from day 22 to day 50. In these mice, peritoneal functions were assessed on day 50 using a traditional peritoneal equilibration test with a 4.25% glucose-based peritoneal dialysis fluid and a peritoneal equilibration test with 7.5% icodextrin peritoneal dialysis fluid. Supplementary Figure 2 - 3
b a Podoplanin Normal methylglyoxal P < 0.05 P < 0.001 P < 0.001 3 Diaphragm 2 Podoplanin positive area (×103 μm2 / 1mm surface length) P< 0.05 n.s. n.s. 1 Parietal 0 Diaphragm Parietal peritoneum c LYVE-1 Podoplanin Merge d P< 0.05 P < 0.001 6 4 Podoplanin mRNA / 18S rRNA 2 0 Parietal peritoneum Normal Normal Diaphragm methylglyoxal methylglyoxal Supplementary Figure 3. Expression of podoplanin-positive lymphatic vessels in the murine diaphragm and parietal peritoneum. Expression of podoplanin-positive lymphatic vessels and podoplanin mRNA were increased mainly in the diaphragm of murine methylglyoxal model similar to other lymphatic endothelial cell markers. (a) Immunohistochemistry for podoplanin of methylglyoxal model mice. Podoplanin has been reported to be expressed by mesothelial cells (Braun N et al., Nephrol Dial Transplant 2011; 26: 1033–1041). Arrows and arrowheads indicate podoplanin-positive lymphatic vessels and mesothelial cells, respectively. scale bars, 100 mm. (b) Quantification of immunohistochemical analyses of podoplanin-positive lymphatic vessels (each group, n=6). (c) Double immunofluorescent staining for podoplanin and LYVE-1 in the diaphragm of a representative methylglyoxal model mouse. scale bars, 50 mm. (d) Podoplanin mRNA expression analyzed by quantitative RT-PCR analyses. n.s., not significant. Supplementary Figure 3
Diaphragm of mouse methylglyoxal model LYVE-1 Peritoneal side Peritoneal side Pleural side a c b d Supplementary Figure 4. Lymphatic vessels in the diaphragm in the mouse methylglyoxal models on day 22. Immunohistochemical analysis identified LYVE-1–positive dilated lymphatic vessels (black arrows) in the thickened diaphragm. In the advanced fibrotic area of the diaphragm, entrances of newly developed lymphatic vessels (red arrows) were revealed in the fibrotic diaphragm. Figs. (b) and (d) are larger magnifications of the boxed areas in Figs. (a) and (c), respectively. Scale bars, 100 μm. Supplementary Figure 4
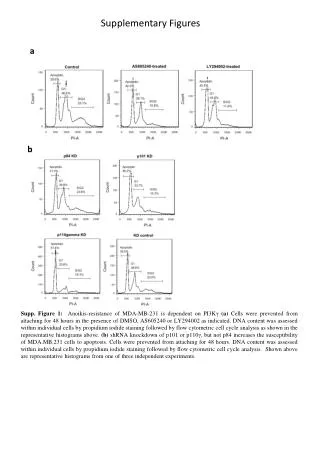
n.s. n.s. P < 0.01 P < 0.05 P < 0.01 n.s. P < 0.05 n.s. a b 6 1.5 4 1.0 VEGF-D in tissue (×103 pg/mg protein) VEGF-C in tissue (×103 pg/mg protein) 2 0.5 0 0 Parietal peritoneum Parietal peritoneum Diaphragm Diaphragm Supplementary Figure 5. VEGF-C and VEGF-D protein expression in the diaphragm and parietal peritoneum of the methylglyoxal model mice. VEGF-C (a) and VEGF-D (b) proteins in the diaphragm and parietal peritoneum of control and methylglyoxal model mice were measured using a mouse VEGF-C ELISA kit (Cloud-Clone Corp., Houston, TX, USA) and a mouse VEGF-D ELISA kit (Biomatik Corporation, Cambridge, Ontario, Canada), respectively. VEGF-D was significantly elevated in the diaphragm of the methylglyoxal model mouse compared to control. In contrast an increase in VEGF-C in the diaphragm or parietal peritoneum could not be detected. These findings were similar to those of VEGF-C and -D mRNA levels. a and b: each group, n=6. Normal Normal methylglyoxal methylglyoxal Supplementary Figure 5
Control Rat Rat MGO model peritoneal side peritoneal side a b Diaphragm pleural side c peritoneal side d peritoneal side Parietal peritoneum e P < 0.001 P < 0.01 n.s. n.s. 3 8 6 n.s. n.s. n.s. n.s. 2 P < 0.05 P < 0.01 P < 0.01 n.s. VEGF-D mRNA / 18S rRNA VEGF-C mRNA / 18S rRNA 4 1 2 0 0 Parietal peritoneum Parietal peritoneum Diaphragm Diaphragm Control MGO model 6 4 3 4 2 VEGFR-3 mRNA / 18S rRNA LYVE-1 mRNA / 18S rRNA 2 1 0 0 Parietal peritoneum Parietal peritoneum Diaphragm Diaphragm Supplementary Figure 6-1
Supplementary Figure 6. Immunohistochemical analyses and qPCR analyses of selected mRNAs in the diaphragm and parietal peritoneal membrane of methylglyoxal-induced peritoneal injury rats. The methylglyoxal model in rats is similar to that in mice. Methylglyoxal model rats were generated in a similar fashion to the mouse methylglyoxal models. Eight-week-old male Sprague–Dawley rats (Japan SLC, Hamamatsu, Japan), initially weighing 240–260 g, were used in this study. Briefly, 100 mL/kg body weight of 2.5% peritoneal dialysis fluid (Dianeal-N PD-4-2.5) containing 20 mmol/L methylglyoxal (MP Biomedicals LLC) was administered intraperitoneally for 3 weeks. Immunohistochemical analysis indicated that LYVE-1–positive lymphatic vessels (black arrows) were increased and dilated in the diaphragm of the rat methylglyoxal models (b, d) compared with controls (a, c); however, lymphangiogenesis was predominant in the diaphragm (b). (e) Quantitative RT-PCR analysis indicated that the mRNA expression of LYVE-1 and VEGFR-3, which are markers of lymphatic endothelial cells, and VEGF-D mRNA expression were increased in the diaphragm of the methylglyoxal models compared to normal controls. However, VEGF-C mRNA expression was not significantly increased in the diaphragm. (each group, n=5). n.s., not significant. Scale bars, 200 μm. Supplementary Figure 6-2
P< 0.001 P< 0.01 600 400 sVEGFR3-Ig Level in Serum (ng / ml) 200 0 Day 22 Day 50 Supplementary Figure 7. The serum concentration of soluble-VEGFR-3 protein was significantly higher on day 22 and day 50 in mice treated with an adenovirus expressing sVEGFR-3 than in mice administered an adenovirus expressing Lac Z. Serum soluble-VEGFR-3-Ig was assayed using an ELISA kit for human IgG1. Lac Z: treatment with Adeno-LacZ, R3-Ig: treatment with Adeno-sVEGFR-3-Ig.(each group, n=6) Lac Z R3-Ig Supplementary Figure 7
10 Control Lac Z 8 R3-Ig 6 Positive cells/HPF 4 2 n.d. n.d. n.d. n.d. n.d. 0 Ly6B CD4 CD8 CD11c Ly6B CD4 CD8 CD11c Control Lac Z sVEGFR3-Ig N. S. N. S. N. S. Intestine (Positive control) Supplementary Figure 8. Immunohistochemical analyses of the diaphragm of control and methylglyoxal model mice. Treatment with soluble VEGFR-3 did not affect the infiltration of immune cells. Scale bars, 50 mm. Immunohistochemical analysis of the indicated immune cells in the diaphragm of control, Lac Z and R3-Ig-treated methylglyoxal model mice. The number of positively labeled cells per high power field (HPF) was counted. Arrows indicate positive staining of the immune cells. Lac Z: treatment with Adeno-LacZ, R3-Ig: treatment with Adeno-sVEGFR-3-Ig. Supplementary Figure 8
a 20 Positive cells/ HPF 10 0 b c 2 n.s. n.s. 4 n.s. VEGF-D in tissue (×103 pg/mg protein) VEGF-C in tissue (×103 pg/mg protein) 1 2 n.s. 0 0 Parietal peritoneum Parietal peritoneum Diaphragm Diaphragm Lac Z Lac Z Lac Z n.s. n.s. n.s. R3-Ig R3-Ig R3-Ig Supplementary Figure 9. There was no difference in the percentage of VEGF-D positive cells or in the level of tissue VEGF-C or -D protein expression between the Adeno-Lac Z or Adeno-sVEGFR-3-Ig –treated methylglyoxal mouse groups. (a) Quantification of VEGF-D and/or CD68 positive cells in the double immunofluorescent staining of the diaphragm in the adenovirus treated methylglyoxal models. each group, n=6. (b) VEGF-C and (c) VEGF-D protein expression in the tissues of methylglyoxal models as assessed using ELISA. each group, n=5. ns., not significant Lac Z: treatment with Adeno-LacZ, R3-Ig: treatment with Adeno-sVEGFR-3-Ig. + + + - + - VEGF-D CD68 Supplementary Figure 9
P< 0.01 n.s. n.s. n.s. a c b P< 0.05 n.s. n.s. 0.25 4 1.00 P< 0.001 n.s. 0.20 3 0.75 0.15 Glucose PET Effluent Volume (×103 μl) D / D0 Glucose D / P Creatinine 2 0.50 0.10 1 0.25 0.05 0 0 0 Control Control LacZ LacZ R3-Ig R3-Ig LacZ LacZ R3-Ig R3-Ig Control LacZ R3-Ig LacZ R3-Ig Day 22 Day 22 Day 50 Day 50 Day 22 Day 50 Supplementary Figure 10. Lymphatic vessels are not involved in the function of solute transport. The mice described in Supplementary Figs. 2b, d were sacrificed on day 22 or day 50 for assessment of ultrafiltration and membrane transport. The animals that received 2,000 mL of a 4.25% glucose-based peritoneal dialysis fluid (Dianeal PD-2-4.25, 3.86% glucose, Baxter) were sacrificed at 2 h after intraperitoneal infusion (Ni J et al. Kidney Int 2005; 67:2021-31). An accurate ultrafiltration volume was measured, and blood samples were obtained. Creatinine, blood urea nitrogen, glucose, and total protein were measured in the plasma and peritoneal dialysis effluent. (a, b) There was no difference between the indicated groups in the ratio of dialysate glucose at 2 h dwell time to dialysate glucose at 0 h (D / D0 glucose) or in the dialysate to plasma ratio (D / P) of creatinine in the 4.25%G-peritoneal equilibration test. The ratio of dialysate glucose at 2 h dwell time to dialysate glucose at 0 h was improved on day 50 by reduction of inflammation. (c) In the 4.25%G-peritoneal equilibration test, the drained volume tended to be increased in the Adeno-sVEGFR-3 group versus the Lac Z group, but this increase was not statistically significant. (each group, n=6). n.s., not significant. Lac Z: treatment with Adeno-LacZ, R3-Ig: treatment with Adeno-sVEGFR-3-Ig. G: glucose based peritoneal dialysis fluid. PET: peritoneal equilibration test. Supplementary Figure 10
a b Without administration of 1.5% PDF With administration of 1.5% PDF PDF: peritoneal dialysis fluid Supplementary Figure 11. Macroscopic observations of the abdominal cavity of methylglyoxal model mice on day 50 in Experiment 3 (without peritoneal lavage from day 22 to day 50) and Experiment 4 (with peritoneal lavage from day 22 to day 50) (a) In Experiment 3 (without peritoneal lavage with 1.5% peritoneal dialysis fluid (PDF) from day 22 to day 50), it was difficult to perform the peritoneal equilibration test because of severe adhesions in the peritoneal cavity. Arrows indicate adhesion sites. (b) In Experiment 4 (with peritoneal lavage using 1.5% peritoneal dialysis fluid from day 22 to day 50), no peritoneal adhesions were found. Supplementary Figure 11
Parietal Peritoneum a LYVE-1 Lac Z R3-Ig 8 n.s. n.s. 6 Day 22 Positive area (×102 μm2 / 1mm surface length) 4 2 Day 50 0 Day 22 Day 50 Parietal Peritoneum b CD31 Lac Z R3-Ig 3 n.s. Day 22 2 n.s. Positive area (×103 μm2 / 1mm surface length) 1 Day 50 Lac Z Lac Z 0 R3-Ig R3-Ig Day 22 Day 50 Supplementary Figure 12. Pathological findings and immunohistochemical analyses of murine parietal peritoneum of methylglyoxal model mice treated with an adenovirus expressing sVEGFR-3 or an adenovirus encoding Lac Z Similar pathological findings were observed in the parietal peritoneal membrane by treatment with Adeno-sVEGFR-3and Adeno-LacZ on day 22 and day 50; however, these findings were weaker than those in the diaphragm. Immunohistochemical analysis and quantification of (a) LYVE-1 positive lymphatic vessels, (b) CD31-positive vessels, (c) expression of type III collagen, and (d) CD68-positive macrophages on day 22 and day 50 in murine parietal peritoneal membrane of mice treated with Adeno-sVEGFR-3or Adeno-LacZ. (each group, n=6). n.s., not significant. Scale bars, 100 mm. Lac Z: treatment with Adeno-LacZ, R3-Ig: treatment with Adeno-sVEGFR-3-Ig. Supplementary Figure 12-1
Parietal Peritoneum c Type III collagen Lac Z R3-Ig 15 n.s. Day 22 10 n.s. Positive area (×103 μm2 / 1mm surface length) 5 Day 50 0 Day 22 Day 50 Parietal Peritoneum d CD68 Lac Z R3-Ig 10 n.s. Day 22 Positive cell count (×10 / 1mm surface length) 5 n.s. Lac Z Lac Z R3-Ig R3-Ig Day 50 0 Day 22 Day 50 Supplementary Figure 12-2
a b P < 0.05 P < 0.01 P < 0.01 20 20 P < 0.01 15 15 10 10 VEGF-C mRNA / 18S rRNA LYVE-1 mRNA / 18S rRNA 5 5 0 0 Pre-dialysis uremia Incident UFF Pre-dialysis uremia Incident UFF Supplementary Figure 13. VEGF-C and LYVE-1 mRNA levels were increased in ultrafiltration failure (UFF) of human peritoneal biopsy samples. Some of these samples were used and evaluated for VEGF-C and LYVE-1 mRNA expression in our previous study (Kinashi H et al., J Am Soc Nephrol 2013; 24: 1627-1642). UFF: ultrafiltration failure. Supplementary Figure 13
0.3 0.2 Phospho-VEGFR-3 O.D. (450 nm) 0.1 0 sVEGFR-3 MAZ51 VEGF-D 0 ng/ml VEGF-D 750 ng/ml (unstimulated) (stimulated) Supplementary Figure 14. Soluble VEGFR-3 inhibits VEGF-D induced VEGFR-3 phosphorylation. Lymphatic endothelial cells (HMVEC-dLy Neo, Lonza Japan, Tokyo, Japan) were seeded onto 60 mm culture dishes and were then starved for 48 h. Starved cells were stimulated with 750 ng/ml recombinant human VEGF-D (R&D) for 30 minutes, in the absence or presence of sVEGFR-3 (115 nM) or the VEGFR-3 kinase inhibitor, 4-dimethylamino-naphthalene-1-carbaldehyde (MAZ51, 50 mM) (Merck Millipore, Darmstadt, Germany). The cells were lysed in lysis buffer and the cell extracts were examined for VEGFR-3 phosphorylation levels using a Human Phospho-VEGF R3/Flt-4 ELISA kit (R&D). Control group, n=4, other groups, n=5 each group. P < 0.001 P < 0.001 P < 0.001 Supplementary Figure 14
Human Conventional Peritoneal Equilibration Test (PET) Diffusion is quantitatively the most important transport mechanism for low-molecular-weight solutes, such as urea and creatinine (Supplementary information 1a). The Peritoneal Equilibration Test is a common method to determine how rapidly two small solutes (creatinine and glucose) cross the peritoneal membrane and to assess peritoneal transport. In this test, after dwelling of a peritoneal dialysate of 2.27% glucose-based dialysis solutions for 4 h, the volume (mL) of effluent in the drain bag is measured and recorded. The 4 h peritoneal effluent sample is collected and the creatinine concentration and glucose concentration are measured. The dialysate/Plasma (D/P) ratio after a 4-h dwell is the most often used evaluation of creatinine in clinical practice and is calculated as follows: A 4-hour dialysate (D) to plasma (P) ratio of creatinine (D/P creatinine) = the creatinine concentration of 4 h effluent samples/serum concentration of creatinine. For evaluation of glucose, which is absorbed from the dialysate to blood very quickly, the following evaluation is used: 4-hour D/D0 glucose = the glucose concentration of 4 h effluent samples/ the glucose concentration of 0 h effluent samples The results are classified into 4 categories as shown in Supplementary information 1b and are useful for deciding the treatment with peritoneal dialysis solutions. (Rodrigues AS Blood Purif. 2007;25:497-504 , Twardowski ZJ. Contrib Nephrol. 2006;150:13-9, Twardowski ZJ. Semin Dial 1990; 3: 141-42) a. b. D/D0 glucose D/P Cr (hour) Supplementary Information 1