Download
1 / 27
270 likes | 432 Views
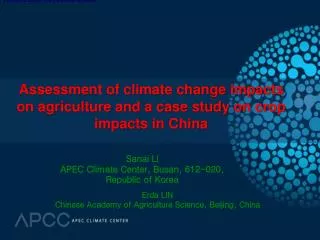
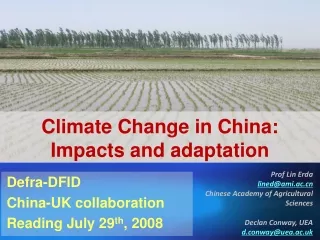
Impacts of Climate Change on Corn and Soybean Yields in China. Jintao Xu With Xiaoguang Chen and Shuai Chen June 2014. Climate change: More Acute in China. In past 100 years: 0.5 ~ 0.8°C; past 5 0 years: 1.1°C In next 100 years: China: +3.9°C~6.0°C; World: +1.1°C ~ 6.4°C.

E N D
Impacts of Climate Change on Corn and Soybean Yields in China Jintao Xu With Xiaoguang Chen andShuai Chen June 2014
Climate change:More Acute in China • In past 100 years: 0.5~0.8°C; past 50 years: 1.1°C • In next 100 years: China: +3.9°C~6.0°C; World: +1.1°C~6.4°C
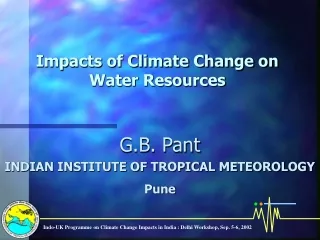
Skewed trend in annualprecipitation(1950-2000) • Less precipitation in drier north • More precipitation in the south where water is abundant Source: China’s weather bureau
Background • Agriculture is vulnerable to climate change • Temperature, precipitation, and solar radiation are direct inputs for agricultural production • There is a growing body of literature examining the impacts of climate change on agriculture in the developed world • Mendelsohn et al. (1994), Schlenker et al. (2006) and Schlenker and Roberts (2009) • This line of studies can guide or misguide climate policy in developing country • Influential studies in China believe positive impacts from climate change
Significance • China’s agriculture • employs more than 300 million farmers • supports over 20% of the world’s population with only 8% of the global sown area • the world’s largest agricultural economy • Corn and Soybean • Important sources of feed grains for livestock production • China is a major importer of corn and soybeans • About 80% of domestic soybean consumption from international markets • Increasing share of corn imports from the world markets
Objectives • Estimate the linkage between weather variables and corn and soybean yields • Predict corn and soybean yields based on IPCC scenarios
Empirical estimation strategy: A spatial error model Yr,t: crop yields Zr,t:weather and technology variables LUCr,t: land use change variables Pr,t:price ratio Ar,t:adaptation to climate change cr: county-fixed effect
Weather variables: Zr,t • Growing Degree-Days (GDDs 8-32°C) is used to represent the relationship between temperature and crop yields • Extremely high temperatures (GDD, 34+) • Cumulative precipitation and radiation over crops’ growing seasons • Both linear and quadric forms to capture the nonlinear effect of weather variables on crop yields • A time trend and quadric time trend to capture the nonlinear effect of exogenous technology changes on crop yields
Regional land use change (LUCr,t) may affect crop yields Marginal land 10 ha Corn 60 ha Soybean 30 ha Year T Marginal land 5 ha Corn 75 ha Soybean 20 ha Year T+1 Substitution acre: 10 ha Marginal acre: 5 ha
Price ratio: Pr,t • Price ratio= Expected crop price/input prices • Capture the effects of relative price changes in output and input prices • Higher input prices, less input use
Climate adaptation behaviors: Ar,t • Farmers may take adaptation behaviors • Invest new technology • Use ground or surface irrigation • Adopt drought-tolerant seeds • A proxy for farms’ climate adaptation behaviors (Greenstone 2007)
Data • County-level panel on crop yields, historical planted (irrigated) acres of major crops for years 2001-2009 • Daily measures of minimum and maximum temperatures, precipitation and radiation from 820 weather stations • Province-level socioeconomic data
Five-year average planted acres of corn and soybean (2005-2009) Soybean Corn
Weather stations in China Daily measures of minimum and maximum temperatures, precipitation and radiation
Results: Impacts of temperature on crop yields • Growing Degree Days (8-32°C) (thousand °C) Corn Soybean The optimal numbers of GDDs: Corn 2300-2700; Soybean 1600-1800
Results: Impacts of precipitation on crop yields (thousand mm) Soybean Corn The optimal numbers of precipitation: Corn 74cm; Soybean 54cm
Results: Impacts of solar radiation on crop yields (1000 hours) Soybean Corn The optimal numbers of radiation: Corn 1000-1200 hours; Soybean 1000 hours
Robustness checks Results are robust to • Alternative spatial weighting matrices • Year-fixed effects • Alternative approach to calculate growing degree days • Rainfed regions only
Regression findings • Finding 1: Nonlinear and asymmetric relationships between corn and soybean yields and weather variables • Finding 2: Extreme high temperatures above 34°C are always harmful for crop growth • Finding 3: Expansion of corn and soybean production areas had detrimental effects on corn and soybean yields • Finding 4: Climate adaptation behavior was actively undertaken for corn production; not significant for soybeans
Economic loss due to climate change Climate change led to a net economic loss of $117-250 million in China’s corn and soybean sectors in 2009.
Climate Change Impacts by Temperature6 IPCC Scenarios Mid-term (2040-2060) Corn yields decrease by 1.5-2%under B1 and by 1.5-4%under A1F1. Soybean yields decrease by 3-4.5%under B1 and 4-8%under A1F1. Long-term (2090-2099) Corn yields decrease by 2-5% under B1 and by 5-15% under A1F1. Soybean yields decrease by 5-10% under B1 and 8-22%under A1F1. Note: Blue: Effect for change in GDD 8-32; Red: GDD 34+; Black: Aggregate Effect
Concluding remarks • Nonlinear and asymmetric relationships between corn and soybean yields and weather variables • Extreme high temperatures are always harmful for crop growth • Expansion of corn and soybean acres had negatively affected corn and soybean yields • Climate change has led to a net economic loss of $117-250 million in 2009 in China’s corn and soybean sectors • Corn and soybean yields in China are expected to decrease by 2-15% and 5-22%, respectively, by the end of this century
Climate Change Impacts by Precipitation and Radiation Precipitation Radiation Changes in precipitation and solar radiation are expected to yield negligible effects on corn and soybean yields (less than 1%)
Comparison with Roberts-ShlenkerMethods • Corn optimal temperature 30 centi., for soybeans 29 centi. • Slightly over-estimates (Average nearly 5%) by RS methods in prediction.
Table 4: Spatial Error Estimations (Dependent Variable: Log Corn Yield)
Table 5: Spatial Error Estimations(Dependent Variable: Log Soybean Yield)