Results Driven Accountability
Results Driven Accountability. What we know. Why Results Driven Accountability?. The primary focus of Federal and State monitoring activities shall be on… improving educational results and functional outcomes for all children with disabilities

Results Driven Accountability
E N D
Presentation Transcript
Results Driven Accountability What we know
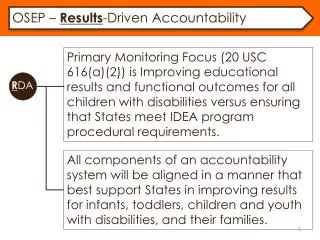
Why Results Driven Accountability? The primary focus of Federal and State monitoring activities shall be on… • improving educational results and functional outcomesfor all children with disabilities • ensuring that States meet… the program requirements, with… emphasis on those most related to improving results 20 U.S.C. 1416(a)(2) Sec. 616(a
Why Emphasis on Results Now? Source: SERRC
Results Driven Accountability “We have to expect the very best from our students—and tell the truth about student performance—so that we can give all students the supports and services they need. The best way to do that is by focusing on results.” Secretary Arne Duncan RDA Press Release, March 2, 2012 Performance of Students with Disabilities Focus on results!
The Three Components of RDA • A Differentiated Monitoring and Support System • The Revised Determinations System • The Revised SPP/APR (including the SSIP)
The Compliance Matrix • Meets Requirements -- at least 90%. • Needs Assistance -- at least 75%, but less than 90%. • Needs Intervention -- less than 75%, and a State met one or more of the following criteria: • Compliance below 50%; • The State provided no data or no valid and reliable data for Indicators 4B, 9, 10, 11, 12, 13, or 15; or • The State has been subject to Special Conditions for multiple years for failing to comply with key IDEA requirements. • Needs Substantial Intervention – The Department did not make a determination of Needs Substantial Intervention for any State in 2013.
The Compliance Matrix For each indicator: 2 = substantial compliance (90% or 95%) 1 = compliance above 75% and below 90 or 95% 0 = compliance below 75% Determination: Meet requirements (Matrix % at least 90%) Needs Assistance (Matric between 75% and 90%) Needs Intervention (Matrix below 75% and other conditions)
12/12/12 Memo 13-6 indicated: • OSEP is developing a “State Results Matrix” that will be used to examine a variety of results data. • Memo included example of a results matrix: Statewide Assessment, based on Indicator 3
Example included in Memo 13-6 State Assessments: 4 measurements • Participation rate in general statewide reading and math assessments (similar to 3b), • Proficiency on assessments (similar to 3a), • State’s data improvement in proficiency on assessments, and • The gap in proficiency on assessments between students with disabilities and all students.
Results Matrix Example Decision Matrix: Reading and Math combined • Element 1: Participation in general assessment • Element 2: Improvement in percent proficient • Element 3: Gap in proficiency between students with disabilities and students without disabilities • Element 4: Percent proficient or above Source: NCEO
Results Matrix Source: NCEO
Could this be the basis for a Results Matrix? Data valid and reliable Some form of ranking Meet targets? Gap Sp. Ed. & Gen. Ed. Will final determination be an average b/w compliance and results determinations?
Bottom line… • “We have to expect the very best from our students—and tell the truth about student performance—so that we can give all students the supports and services they need. The best way to do that is by focusing on results.” • Secretary Arne Duncan • RDA Press Release, March 2, 2012 Student Performance Focus on results!
Revised SPP/APR including the State Systemic Improvement Plan
State Systemic Improvement Plan - SSIP • The SSIP is reported in the state’s SPP/APR (Indicator 17 for Part B). • While the primary focus of the SSIP is on improved outcomes and results, the State must also address how it will use its general supervision systems to improve implementation of the requirements of the IDEA.
Determine contributing factors of problems in areas for improvement Identify and analyze key data, from APR and other sources, disaggregate data Establish baselines and targets for all indicators Refine data analysis – addressing issues of data quality Root Cause Analysis Start SPP/APR and Phase I of SSIP Activities Draft SSIP Identify focus for improvement Identify areas for improvement Draft Theory of Action Conduct infrastructure analysis February 2015 Submit APR FALL 2013 SPRING 2014 SUMMER 2014 FALL 2014 Engage stakeholders in determining areas for improvement and focus for improvement Inform stakeholders re. changes to SPP/APR & SSIP* Work with LEAs/LAs and other stakeholders to identify and select evidenced based practices Review Theory of Action with stakeholders Plan: consider the management of the SSIP process including the activities related to the design and implementation of the SSIP Data Related Activities * Please refer to OSEP Memorandum 05-12 regarding requirements for stakeholder input. SSIP Specific Activities State Processes
Phase I ● at-a-glance February 2015 Submit APR Data Analysis • Focus for Improvement • Infrastructure Analysis • Theory of Action FALL 2013 SPRING 2014 SUMMER 2014 FALL 2014 Phase II ● at-a-glance February 2016 Submit APR Evaluation Plan • Infrastructure Development • Support LEA/LA Implementation FALL 2014 SPRING 2015 SUMMER 2015 FALL 2015 Phase III ● at-a-glance Support LEA/LA Implementation • Results of Ongoing Evaluation • Revise SPP February 2017 Submit APR FALL 2015 SPRING 2016 SUMMER 2016 FALL 2016